APPLIED INDUSTRIAL CONTROL SOLUTIONS
ApICS LLC
Dynamometer Control System Design & Analysis
of an
Automotive Transmission Test Stand
Brian T. Boulter
© ApICS ® LLC 2000
ABSTRACT
This report details the modeling, simulation and resulting control scheme configuration recommendations for a proposed automotive dynamometer transmission test stand. The test stand is innovative in that electric motors and drives are being used to emulate both the engine and vehicle inertias, and the road/vehicle loading of the transmission.
The control strategy that is to be used in the final design is also presented. Results of a simulation from an adequately detailed model of the transmission, drive train including the test stand, and transmission torsional dynamics, are also presented.
INTRODUCTION
Scope
This report presents a detailed description of the modeling, simulation and resulting dynamometer control scheme configuration development and recommendations for a proposed automotive transmission test stand.
Objective
An adequately detailed model of the proposed test stand was developed. The purpose of the modeling and investigation was to observe the effectiveness of the described dynamometer control scheme during transmission gear changes.
Specifically, the effectiveness of the dynamometer engine inertia emulation algorithm and the road load/vehicle inertia emulation algorithm, during gear changes, for a set of loaded/unloaded grade/no-grade operating conditions was to be investigated. The methodologies used in the simulation were based on algorithms and modeling approaches found in [2,5,6,7].
A simple engine model and a road-load model is also presented. A method that is to be used in the final implementation of both the engine model and the described control strategy is also described. The results of the investigations are presented in this SR.
Report Overview
The report is divided into four sections. The first chapter defines a set of useful terms, and the governing first principal equations; the second describes the simulation structure. The third chapter presents the results from simulations of the system, and finally the fourth chapter contains a set of concluding remarks.
CHAPTER 1
FIRST PRINCIPAL EQUATIONS
Introduction
The equations describing the dynamics of the sub-systems that comprise a typical dynamometer transmission test stand have been described in detail in the ApICS systems engineering course 10 "Advanced Dynamic Simulation" [2] and several research sources [5,6,7]. The friction models used were obtained from [2,3,4]. The descriptions of the describing equations used in this simulation are only brief and are not intended to be rigorous. The derivation of the describing equations used in this report can be found in the same reference material.
The one exception is the modeling technique used to provide the simulation with an adequately accurate representation of the transmission dynamics during a gear-shift in the test stand. A more detailed explanation of the methodology used is presented.
Nomenclature:
|
s |
Laplace operator |
|
WKi 2 |
iíth inertia [lb ft^2] |
|
W |
Vehicle weight [lbf] |
|
Ji,m |
iíth motor inertia [slugs] |
|
Ji,l |
iíth reflected load inertia [slugs] |
|
Ji |
Ji,m + Ji,l iíth total reflected Inertia [slugs] |
|
JVEH |
Simulated vehicle inertia [slugs] |
|
JDiff |
Difference between the DC motor inertia and the emulated engine inertia [slugs] |
|
Vi |
Vehicle velocity [mph] |
|
qi, m |
iíth motor shaft position [rad] |
|
qi |
iíth shaft position [rad] |
|
Sb,i |
iíth motor base speed |
|
HPi |
iíth motor horsepower |
|
w i,m |
i'th motor rotational velocity feedback [rpm] |
|
w i |
i'th motor rotational velocity feedback [rad/sec] |
|
w i,s |
i'th drive-shaft rotational velocity feedback [rad/sec] |
|
w ri |
i'th motor rotational velocity reference [rpm] |
|
wt I |
INPUT stand natural frequency [rad/sec] |
|
wt O |
OUTPUT stand natural frequency [rad/sec] |
|
wI, Crossover |
INPUT stand res-comp crossover freq. [rad/sec] |
|
wO, Crossover |
OUTPUT stand res-comp crossover freq. [rad/sec] |
|
wN I |
INPUT stand res-comp numerator frequency [rad/sec] |
|
wN O |
OUTPUT stand res-comp numerator frequency [rad/sec] |
|
w DI |
INPUT stand res-comp denominator frequency [rad/sec] |
|
w DO |
OUTPUT stand res-comp denominator frequency [rad/sec] |
|
zN I |
INPUT stand res-comp numerator damping [rad/sec] |
|
zN O |
OUTPUT stand res-comp numerator damping [rad/sec] |
|
z DI |
INPUT stand res-comp denominator damping [rad/sec] |
|
z DO |
OUTPUT stand res-comp denominator damping [rad/sec] |
|
BV,i |
i'th Viscous friction gain [lb ft sec / rad] |
|
BW,i |
i'th Square-law windage friction gain [lb ft sec^2 / rad^2] |
|
BC,i |
i'th Coulomb friction gain [lb ft sec / rad] |
|
BS,i |
i'th Stiction friction offset gain [lb ft sec / rad] |
|
Bf,i |
i'th High frequency torque transmission damping gain [sec^2 / rad] |
|
KSP,i |
i'th Drive-shaft spring stiffness (with mapping, or as a constant) [lbf ft / rad] |
|
ROUT |
Wheel radius [ft] |
|
Ri |
iíth roll radius |
|
GRINPUT |
INPUT stand motor gear ratio |
|
GRDIFF |
Differential gear ratio |
|
DIFFEFF |
Differential efficiency |
|
HPINPUT |
INPUT stand motor horsepower [HP] |
|
HPOUTPUT |
OUTPUT stand motor horsepower [HP] |
|
t i,m |
iíth drive-shaft reflected shaft torque [lb ft] |
|
t i,s |
iíth drive-shaft torque [lb ft] |
|
t LOSS,i |
iíth loss torque [lb ft] |
|
t i,f |
iíth high frequency transmission torsional loss torque [lb ft] |
|
t i,max |
iíth motor maximum torque [lb ft] |
|
FLOAD |
loading force [lbf] |
|
KSP,i |
iíth shaft torque/deflection curve gain constant [lb ft/rad] |
|
KO, |
OUTPUT stand torque gain constant [] (1 in this simulation) |
|
KI, |
INTPUT stand torque gain constant [] (1 in this simulation) |
|
K,i,RES |
INPUT/OUTPUT Stand res-comp gain [] |
|
av |
acceleration constant [ft/sec^2] |
|
q max |
Maximum grade [deg] |
|
jV |
Vehicle jerk [ft/sec^3] |
|
g |
Gravity accel. 32.2 ft/sec^2 |
|
gc |
Gravitation constant 32.2 [lbft/lbf-sec^2] |
|
RR |
Rolling resistance const [] |
|
RRG |
Rolling resistance gain [sec / ft] |
|
Af |
Effective frontal area of vehicle [ft^2] |
|
CDrag |
Drag co-efficient [lbf / ft^2] |
|
VH |
Headwind velocity [mph] |
System Description:
The test-stand specifications are described in detail in [1]. A mechanical one-line diagram of the test stand is shown in Figures 1 and 2. The inertias (Ji) and system spring energy storage elements (Ki) are shown, along with the descriptive names for each of the major components.
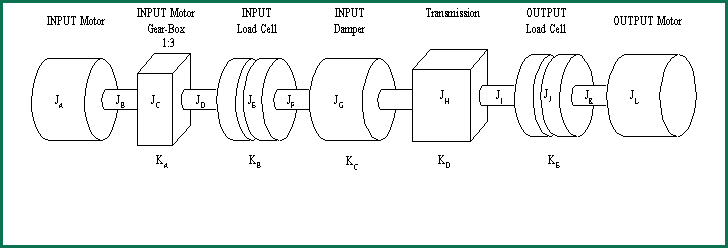
Figure 1-1. Test Stand Mechanical Configuration
The following inertia magnitudes were used in the simulation:
|
JA |
290 / 32.2 [slugs] |
|
JB |
0.5 / 32.2 [slugs] |
|
JC |
24 / 32.2 [slugs] |
|
JD |
0.5 / 32.2 [slugs] |
|
JE |
0.5 / 32.2 [slugs] |
|
JF |
0.5 / 32.2 [slugs] |
|
JG |
1.3 / 32.2 [slugs] |
|
JH |
5 / 32.2 [slugs] |
|
JI |
0.5 / 32.2 [slugs] |
|
JK |
0.5 / 32.2 [slugs] |
|
JL |
290 / 32.2 [slugs] |
Unnecessary detail in the above model can be removed and a simpler model will result. The simplification of the model will remove high frequency resonant modes that are not of interest in the simulation. These modes result from the very stiff springs and low inertias of the shafts that couple the system components together. Figure 1-2 shows the simplified model.
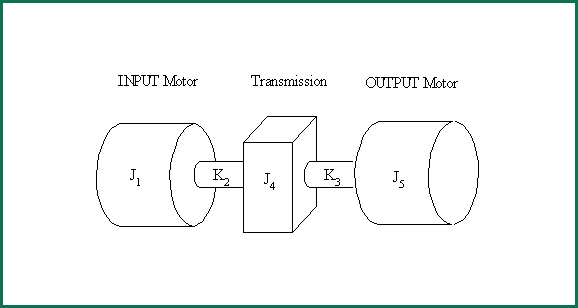
Figure 1-2. Simplified Test Stand Mechanical Configuration
The inertias shown in Figure 1-1 were lumped and used in the simplified model shown in Figure 1-2:
|
J2 |
[JC/9 + JD + JE/2] / 32.2 [slugs] |
|
J3 |
[JE/2 + JF + JG + JH/2] / 32.2 [slugs] |
|
J1 |
[JA + JB + JC 8/9 + (J2 +J3)/2] / 32.2 [slugs] |
|
J4 |
[JH/2 + JI + JJ/2 + (J2 +J3)/2] / 32.2 [slugs] |
|
J5 |
[JJ/2 + + JK + JL] / 32.2 [slugs] |
The springs K2 and K3 are described in the following section.
Describing Equations:
The simulation of the test-stand is composed of equations that describe the INPUT/OUTPUT stand drive-trains, the simplified transmission model, the simplified engine emulation algorithm, the Distributed Control System (DCS) controller function block algorithms, the final INPUT/OUTPUT stand DCS control algorithms, and the reference generation algorithms.
The equations used to describe the drive-trains, the transmission, the DCS function block algorithms/controller designs, and the reference generation algorithms were provided by the author, the engine emulation [8] and road-load [9] algorithms are industry standard.
The algorithms used to emulate the DCS function blocks used in the simulation are similar to those used in a typical DCS processor. The difference equations, floating point precision, and all associated logic functions for each function block are coded in Simulink ™ using the Simulink ™ S-Function feature. This is the method of choice for simulating DCS discrete control schemes for three reasons: 1) The discrete nature of the controller is closely approximated (including transport delays associated with function block execution times) 2) The non-linear "tricks" used in DCS control implementations can be implemented exactly as they will be in the final design. 3) The final design can be taken verbatum from the simulation.
INPUT/OUTPUT Stands Drive Train Equations:
The equations describing the dynamics of the INPUT and OUTPUT stand drive trains are non-linear in nature. To assist in the description of these non-linear equations a linearized model is first described, then the modifications to the linearized model are presented with an explanation and supporting diagrams.
The equation describing the relationship between motor torque and shaft speed is given (1.1) as:
 ; (1.1) ; (1.1)
where the loss torque is a non-linear contribution that is a function of the magnitude and direction of the shaft speed. Equation (1.2) is a popular model that adequately represents the non-linear aspects of friction [2,3,4].
 (1.2a) (1.2a)
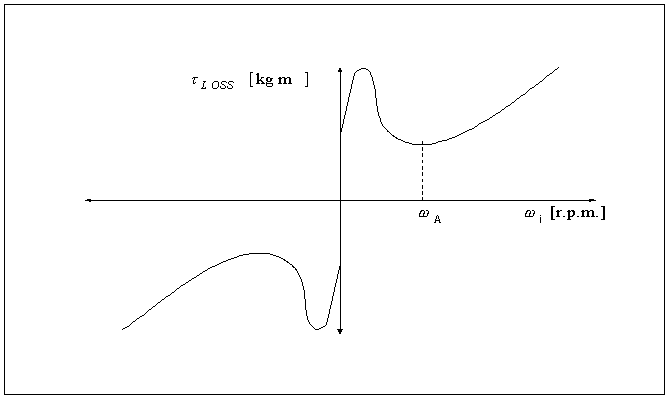
Figure 1-3. Graph of Typical Loss Torque shown in (1.2)
An additional non-linear damping term is included in the simulation. This term is useful when it is desirable to provide a more accurate simulation of the damped high frequency torsional modes of a simulated drive train [2].
 ; (1.3a) ; (1.3a)
In a simulation (1.3a) is usually filtered with a 1st or 2nd order filter. For this simulation a first order filter was used. To keep the equation description manageable the filter equation is not included in (1.2b,c)
The resulting loss torque equation for a transmission system is:
 (1.2b) (1.2b)
Given that the square law losses, and the stictional loss offset in a test stand of this type are small and can be neglected, the final loss torque equation used in the simulation for this report is given as:
 (1.2c) (1.2c)
For applications where a drive train model is not needed the above description (1.1, 1.2) is adequate, however in this analysis, a representation of the drive train dynamics was required, in order to explore the dynamics associated with gear changes in the transmission.
To model the transmission and include the characteristic torque deflection curves of the load-cell and OUTPUT stand transmission drive train, the above differential equation must be derived to represent the system in terms of rotational displacement, rather than speed. This is because a representation of the non-linear characteristics of a transmission/drive-train (such as backlash) are defined in terms of a change in torque, for a given change in shaft displacement. Figure 1-4 represents a typical torque-deflection curve for a load-cell. This figure shows the "hysteresis region" or the "backlash" region, where a relative large change in shaft displacement produces little or no change in shaft torque. It also shows the non-linear nature of the mapping between the shaft deflection [rad/sec] and the required shaft torque [lb ft] to produce the deflection.
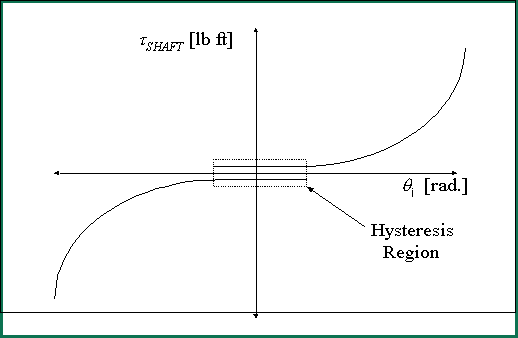
Figure 1-4. Graph of Typical shaft/gear-box Torque/deflection Curve
The linearized equations describing the relationship between shaft position, shaft torque and inertia acceleration, can be found in CH 2 and 3 of [2]. They are summarized below:
 ; (1.3a) ; (1.3a)
 ; (1.3b) ; (1.3b)
The model should implemented in such a way that the torque-deflection curve for KSP,i is included (using a function look-up table).
The following tables describe the torque-deflection curves for the INPUT stand load-cell/damper, and the OUTPUT stand drive train. 0.001 [rad] of backlash was also included in the model.
Table No. 1 Torque Deflection data for the INPUT stand load-cell/damper
|
Deflection [rad] |
0.139 |
0.109 |
0.001 |
-0.001 |
-0.109 |
-0.139 |
|
Load [lb ft] |
2397 |
1106 |
36 |
-36 |
-1106 |
-2397 |
Table No. 2 Torque Deflection data for the OUTPUT stand drive train
|
Deflection [rad] |
0.1 |
0.05 |
0.001 |
-0.001 |
-0.05 |
-0.1 |
|
Load [lb ft] |
0.47 e5 |
0.24 e5 |
360 |
-360 |
-0.24 e5 |
-0.47 e5 |
Transmission Modeling:
The transmission model for this simulation had to be implemented with sequenced logic to provide a reasonable emulation of a gear-change in the transmission. Some additional non-linear damping terms were included to simulate the damping effect of the clutch mechanism.
An S-Curve generator is used to provide the reference for the gear-change in the transmission. The rise time for the S-curve is user programmable. For the simulation 500 [msec] was used.
At a pre-scribed time during the simulation a change in the transmission gear-ratio is accomplished by passing the S-curved gear-ratio change to the appropriate multiply blocks in the shaft position (transmission side) and load torque feedback (transmission side).
A rate detect block (a derivative of the gear-ratio) is used to detect the change in gear-ratio and reduce the load torque reflected back to the engine emulation motor by a factor of 2. Simultaneously, the torque driving the output of the transmission is de-coupled from the input of the transmission (emulating the disengaging of the transmission gears). The circuit accomplishes this in approximately 50 [msec].
The rate output of the S-curved gear-change is also used to multiply the viscous damping friction term on the OUTPUT stand side of the transmission, this provides a simple emulation of the frictional damping that arises from surface friction in clutch mechanisms.
When the simulated transmission gears have been de-coupled, a synchronization circuit is engaged to ensure that the re-coupling of the transmission gears occurs with a shaft displacement difference that is approximately zero. This minimizes the load-torque shock that occurs when the simulated gears re-couple.
Engine Emulation Equations:
The engine emulation algorithm and the model remain proprietary and are therefore not presented in this SR.
Distributed Control System (DCS) stand Controller Equations:
The Equations describing the DCS controllers can be divided into three types: 1) Unit conversion equations, 2) Stability related equations. 3) Road-Load equations.
Unit Conversions
The Unit conversion equations used in the simulation were based on the use of Imperial and per-normal (i.e. per-unit) units. The mappings from Imperial to per-normal units, and from per-normal to Imperial units are given below:
|
Measure |
From |
To |
Using |
|
Inertia |
[lb ft^2] |
[slugs] |

|
|
Inertia |
[lb ft^2] |
[sec] |

|
|
Torque |
[lb ft] |
[PN] |

|
|
Torque - Speed |
[lb ft] |
[rad/sec] |

|
|
Rotational Speed |
[rpm] |
[PN] |

|
|
Rotational Speed |
[rad/sec] |
[rpm] |

|
|
Translational Speed |
[mph] |
[rad/sec] |

|
|
Angle |
[deg] |
[rad] |

|
Stability Equations
To keep the stability equations manageable, the equations describing the stability of the regulators are derived without including the feed-forward terms, or LAG terms that are outside the frequency range of interest. For small signal analysis techniques, these are a valid assumptions.
INPUT Stand
The INPUT stand DCS regulator is composed of a feed-forward torque reference generator, a resonance compensation regulator, and an inertia emulation feed-forward torque reference generator.
INPUT stand feed-forward torque reference
The feed-forward torque reference is computed by multiplying the output of the Engine model by a normalizing gain term, and then feeding the scaled signal to the fast (3000 [rad/sec]) AC vector torque minor loop. To protect the drive-train from accidental damage, the signal is lagged with a 20 [rad/sec] low pass filter. This is to prevent drive-train damage that could result from the accidental application of a torque step from the engine model algorithm, to the torque minor loop.
The scaling of the Engine model torque reference is given below:
 (1.4) (1.4)
INPUT stand resonance compensation tuning philosophy
The basic tuning philosophy of the resonance compensation algorithm is to provide approximate pole-zero cancellation of the dominant 2nd order resonant pole pair in the plant. This approach is NOT recommended if the regulator is required to have good response to a command reference, but it is very useful if the controller is only required to dampen the dominant torsional frequency in the test stand. To accomplish this the numerator of the resonance compensation regulator is tuned to approximately cancel the dominant 2nd order pole pair in the transmission stand. The numerator poles are tuned to provide adequate bandwidth by providing two real poles, one at a fairly low frequency, the other at a frequency that is high enough to not significantly reduce the phase margin of the regulator. The gain is selected to give a crossover of approximately 2 -> 3 [rad/sec]
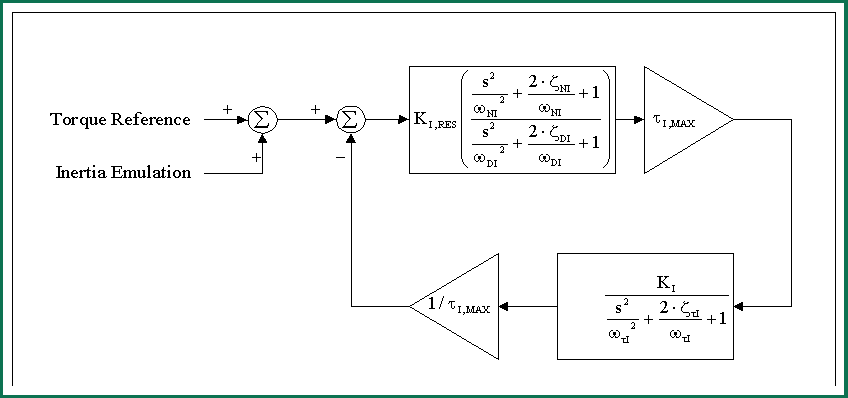
Figure 1-15. INPUT stand Resonance Compensator Block Diagram
INPUT stand open loop transfer function
The INPUT stand open loop transfer function is given as:
 (1.5) (1.5)
Tuning:
 , ,  , ,  , ,  , , 

(Note: KI = 1 in this application)
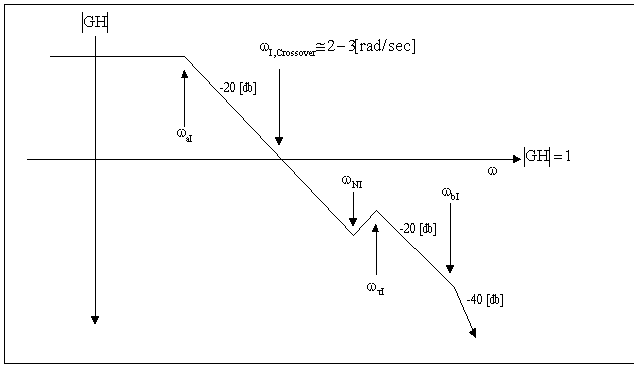
Figure 1-16. INPUT stand Resonance Compensator Assymtotic Bode Plot
INPUT stand inertia emulation algorithm
The inertia emulation algorithm is derived from (1.1) :
 ; (1.1) ; (1.1)
The actual motor Inertia (Ji) will differ from the desired emulation inertia (JE) :
 ; (1.6) ; (1.6)
using superposition and substituting (1.6) into (1.1) to emulate the engine inertia:
 ; (1.7) ; (1.7)
Assuming that the frictional losses in the electric motor are negligible, The additional term for the difference inertia can be computed as an additional torque reference to the AC motor torque minor loop feed-forward reference. Recall that the feed-forward torque reference is computed by the engine model. Therefore, the equation describing the dynamics of the INPUT stand, including inertia emulation, is:
 ; (1.8) ; (1.8)
where:
 (1.9) (1.9)
OUTPUT Stand
The OUTPUT stand DCS regulator is composed of the same sub-systems as the INPUT stand controller, with the exception that a road-load model is also included.
OUTPUT stand feed-forward torque reference
The feed forward torque reference signal can be used to assist the output load regulator to respond to torque changes on the input of the transmission. It may be used to feed-forward a compensating torque, computed from the INPUT stand torque reference, that is sequenced and shaped as a function of the torque transmission properties of the gear shift in the transmission, to effectively reduce torque stresses on the transmission. The implementation of this signal is heuristic, and cannot be supported with describing equations.
OUTPUT stand resonance compensation tuning philosophy
Same as the INPUT stand controller:
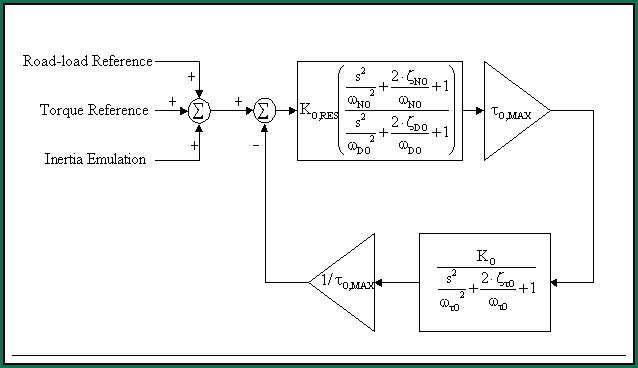
Figure 1-17. OUTPUT stand Resonance Compensator Block Diagram
OUTPUT stand open loop transfer function
The OUTPUT stand open loop transfer function is given as:
 (1.10) (1.10)
Tuning:
 , ,  , ,  , ,  , ,

(Note: K = 1 in this application)
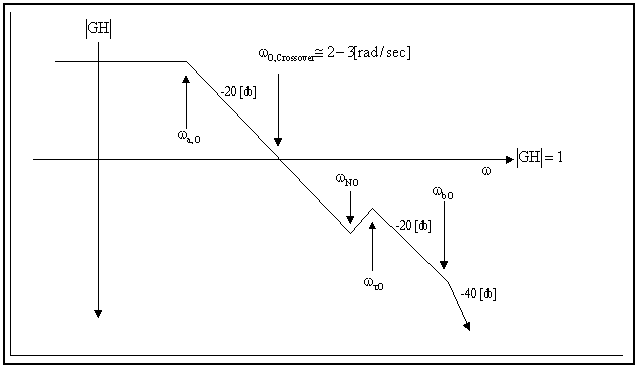
Figure 1-18. OUTPUT stand Resonance Compensator Assymtotic Bode Plot
OUTPUT stand inertia emulation algorithm
The OUTPUT stand inertia emulation algorithm is derived the same way as shown for the INPUT stand. The only difference is that the emulated inertia is the Vehicle inertia, not the engine inertia. To compute the simulated Vehicle inertia reflected to the OUTPUT stand, from the vehicle wheels, through the differential, the following equation (1.9) is used:
 ; (1.11) ; (1.11)
OUTPUT stand road-load algorithm
The road-load equations used in the simulation are presented verbatum from [9]. The total force [lbf] required to overcome road-load is:
 (1.12) (1.12)
The component forces [lbf] are computed as:
 (1.13) (1.13)
 (1.14) (1.14)
 (1.15) (1.15)
The resulting torque [lb ft] produced by the road load is computed by multiplying the load force FTE [lbf] by the wheel radius [ft]. If braking is to be simulated, the braking torque tBrake [lb ft] is added to the road load torque.
To compute the resulting shaft torque [lb ft] at the OUTPUT stand (or output of the transmission), the road load torque is divided by the product of the differential gear-ratio and drive train efficiency. The following equation is used:
 (1.16) (1.16)
Braking torque was not included in the simulation. If braking is desired to be simulated, the appropriately ramped brake torque reference should be sequenced to engage at the desired time and then be added to the torque reference of the OUTPUT stand. Care should be taken to ensure that the sign of the brake torque is correct.
The values used for the road-load algorithm in the simulation are:
|
q MAX |
= 5 [deg] |
|
GRDIFF |
= 5.38 |
|
RR |
= 0.636 [] |
|
RRG |
= 0.0053 [sec/ft] |
|
AF |
= 85 [ft^2] |
|
W |
= 20000 [lbf] (unloaded), 42000 [lbf] (loaded) |
|
CDrag |
= 0.55 [lbf/ft^2], VH = 0 [mph] |
|
ROUT |
= 22/12 [ft] |
CHAPTER 2
SIMULATION STRUCTURE
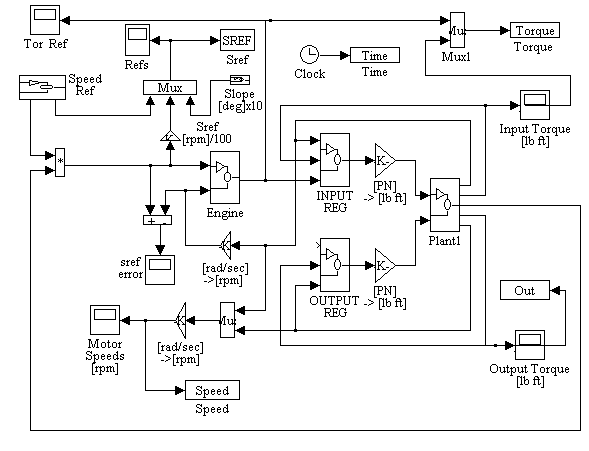
Figure 2-1. Simulation Main Block Diagram
Main block diagram description
The main block diagram is composed of a sub-system representing the engine model (Engine), a subsystem representing the INPUT stand torque regulator (INPUT REG), a sub-system representing the OUTPUT stand torque regulator (OUTPUT REG), and a sub-system representing the test bed (Plant1)
An [rpm] speed reference is generated by passing a step through an s-curve generator, and multiplying the resulting reference by the effective transmission gear-ratio. The need to multiply the reference by the gear-ratio arises from the need to supply the engine speed governor regulator with an engine speed reference [rpm], while the command speed reference is designed to represent the vehicle speed. Therefore a change in gear-ratio in the transmission for a given vehicle speed reference will necessitate a corresponding change in the vehicle motor speed reference.
Several unit conversions are displayed on the main block diagram, these conversions are required to convert [rad/sec] ę [rpm], or [PU] torque references ę [lb ft].
Variables that need to be plotted for the simulation results are exported to the work space for plotting (Time, SREF, Speed, Torque, Out).
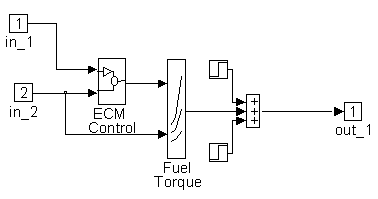
Figure 2-2. Engine Sub-System Block Diagram
Engine Sub-System block diagram description
(Proprietary)
Block Inputs:
[1] Engine Speed Reference [rpm]
[2] Engine Speed Feedback [rpm]
Block Outputs:
[1] Input stand motor torque reference [lb ft]
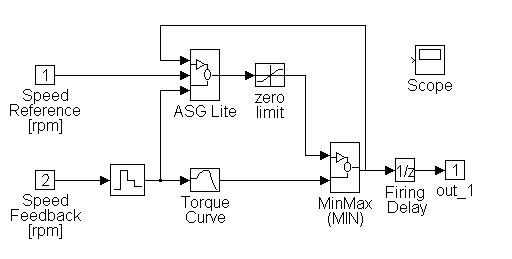
Figure 2-3. ECM Control Sub-System Block Diagram
ECM Control Sub-System block diagram description
(Proprietary)
Block Inputs:
[1] Engine Speed Reference [rpm]
[2] Engine Speed Feedback [rpm]
Block Outputs:
[1] Fuel-rate [gal/hr]
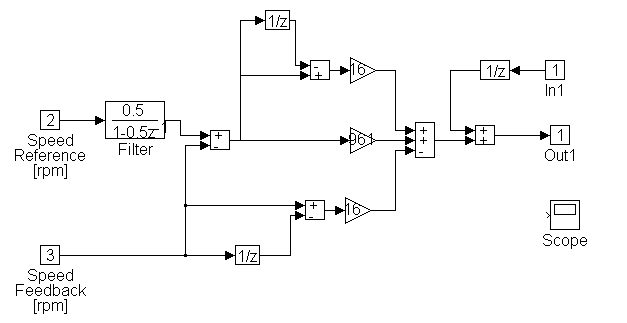
Figure 2-4. ASG Lite Sub-System Block Diagram
ASG Lite Sub-System block diagram description
(Proprietary)
Block Inputs:
[1] Fuel-Rate Feedback[gal/hr]
[2] Engine Speed Reference [rpm]
[3] Engine Speed Feedback [rpm]
Block Outputs:
[1] Fuel-Rate [gal/hr]
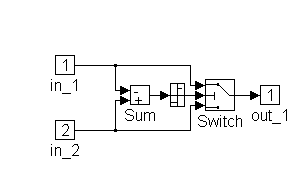
Figure 2-5. Min-Max (MIN) Sub-System Block Diagram
Min-Max (MIN) Sub-System block diagram description
The Min-Max sub-system is a simple switching circuit that can be configured to select either the minimum or the maximum of two input signals. In this case the block was configured to select the minimum.
Block Inputs:
[1] Constrained Governor Fuel-Rate [gal/hr]
[2] Fuel-Rate (from look-up table) [rpm]
Block Outputs:
[1] Minimum Fuel-Rate [gal/hr]
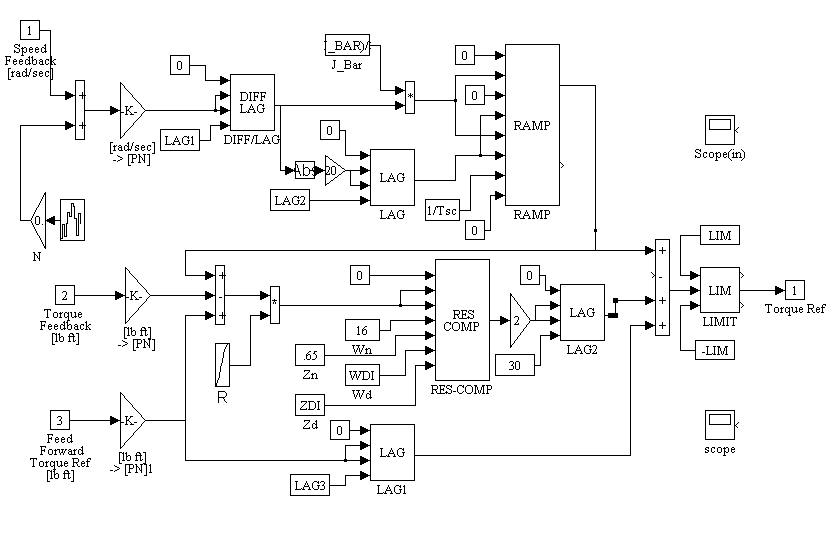
Figure 2-6. INPUT REG Sub-System Block Diagram
INPUT REG Sub-System block diagram description
The INPUT stand torque regulator is composed of three main sections: The feed-forward torque reference generator, the resonance compensation regulator, and the inertia emulation algorithm. Each of these are described below.
The first section computes the feed-forward torque reference. This reference is scaled to produce the shaft torque necessary to generate the desired engine model output shaft torque reference at the input of the transmission. To accomplish this the torque reference that is computed from the engine model [lb ft] is normalized, divided by the gear-box gear ratio, and fed forward through a lag block (with a corner frequency [LAG3] of 20 [rad/sec]).
The second section of the INPUT stand torque controller, the resonance compensation regulator, is composed of a 2nd order filter with the numerator corner frequency and damping set to approximately cancel the dominant 2nd order open loop natural frequency of the system. The denominator corner frequency is set to approximately 2/3rd the dominant second order system open loop natural frequency, with the damping set at 4.0. The high damping ensures that the filter has two real poles. The lower pole is used to provide low frequency gain, and reduce steady state error. The higher pole is forced out of the frequency range of interest. (See Chapter 1 for a detailed description)
The resonance compensation regulator is not designed to provide a regulator that is responsive to a command reference. Itís main function is to provide damping of the dominant 2nd order system natural frequency. The feed-forward torque reference provides a fast response to a command reference. An additional lag is provided on the output of the regulator to minimize excitation effects due to transient phenomena.
The third section of the INPUT stand torque regulator is the inertia emulation algorithm. This algorithm provides an additional torque reference to the motor drive. The additional torque that is added is a function of the derivative of the motor speed feedback and the difference between the desired emulation engine inertia, and the actual electrical motor inertia. The algorithm is effectively adding the required torque to accelerate the inertia difference, thereby creating an effective "load" inertia reflected to the transmission, that is equal to the design engine inertia. (see Chapter 1 for a detailed description)
To make the inertia emulation algorithm noise tolerant, a novel ramp rate control scheme is deployed. This scheme allows low frequency components of the speed feedback derivative to pass without phase shift, while heavily attenuating high frequency components of this signal. When taking the derivative of a noisy signal it is highly desirable to attenuate the high frequency terms. To verify the noise immunity of the speed feedback derivative, the simulation includes noise in the speed feedback that would be equal to 1 part in 500 of RMS noise (i.e. a signal with approximately a 50 [db] signal to noise ratio, which is typical for these types of systems).
Block Inputs:
[1] INPUT stand Speed feedback [rpm]
[2] INPUT stand Torque feedback [lb ft]
[3] INPUT stand Torque reference [lb ft]
Block Outputs:
[1] INPUT stand Motor torque [lb ft]
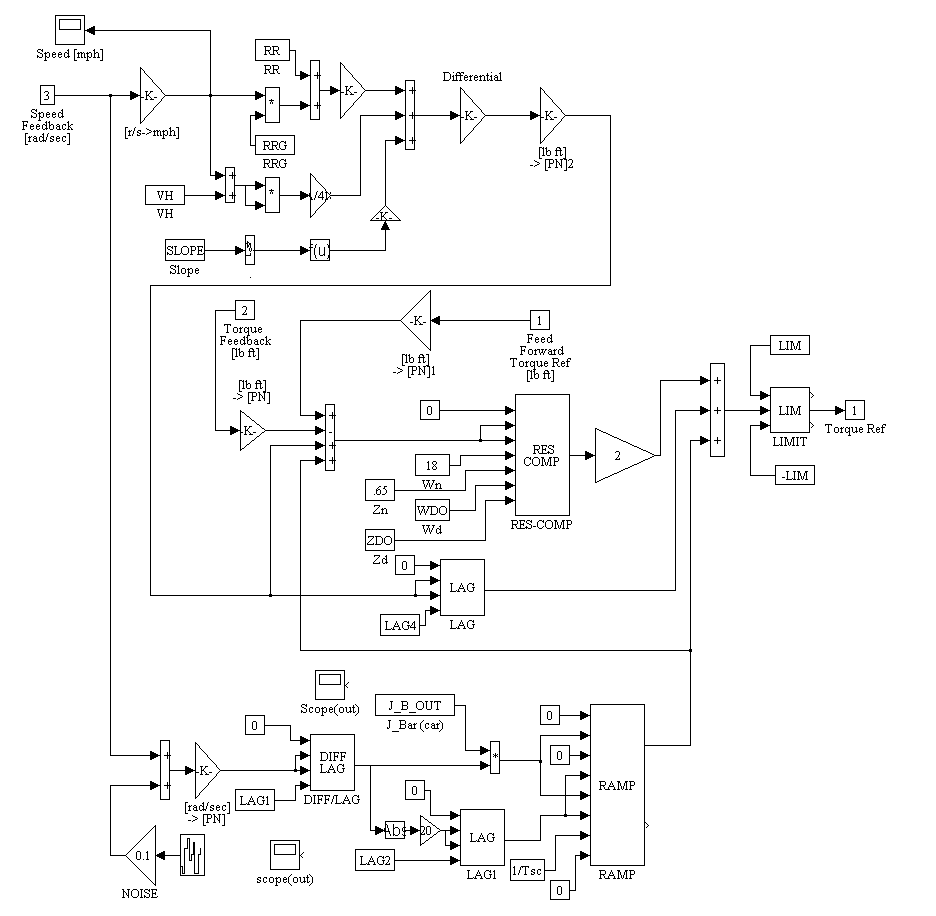
Figure 2-7. OUTPUT REG Sub-System Block Diagram
OUTPUT REG Sub-System block diagram description
The OUTPUT stand torque regulator is composed of four main sections: The feed-forward torque reference generator (not used as of 10/12/99), a resonance compensation regulator, an inertia emulation algorithm, and a road load emulation algorithm. Each of these are described below.
The first section computes a feed-forward torque reference. This signal can be used to assist the output load regulator to respond to torque changes on the input of the transmission. For example, if the transmission is being excessively stressed during gear-changes, this signal may be used to feed-forward a compensating torque, computed form the INPUT stand torque reference, that is sequenced and shaped as a function of the torque transmission properties of the gear shift in the transmission, to effectively reduce torque stresses on the transmission. This feature was not used in this simulation. It may need to be implemented at start-up, if the transmission stresses are excessive.
The feed-forward reference is scaled to produce the shaft torque necessary to generate the desired shaft torque at the output of the transmission. To accomplish this the torque reference that is computed from the feed-forward torque shaping algorithm [lb ft] is normalized, divided by the gear-box gear ratio, and fed into the resonance compensation regulator. (It may also have to be added to the torque minor loop reference, through a lag block with a corner frequency of 20 [rad/sec])
The second section of the OUTPUT stand torque controller, the resonance compensation regulator, is composed of a 2nd order filter with the numerator corner frequency and damping set to approximately cancel the dominant 2nd order open loop natural frequency of the system. The denominator corner frequency is set to approximately 2/3rd the dominant second order system open loop natural frequency, with the damping set at 4.0. The high damping ensures that the filter has two real poles. The lower pole is used to provide low frequency gain, and reduce steady state error. The higher pole is forced out of the frequency range of interest with the high damping term. (See Chapter 1 for a detailed description)
The resonance compensation regulator is not designed to provide a regulator that is responsive to a command reference. Itís main function is to provide damping of the dominant 2nd order system natural frequency. The feed-forward torque reference provides a fast response to a command reference. An additional lag is provided on the output of the regulator to minimize excitation effects due to transient phenomena.
The third section of the OUTPUT stand torque regulator is the inertia emulation algorithm. This algorithm provides an additional torque reference to the motor drive. The additional torque that is added is a function of the derivative of the output stand speed feedback and the design vehicle inertia. The algorithm is effectively adding the required torque to emulate a "load" inertia reflected to the output of the transmission, that is equal to the design vehicle inertia. (see Chapter 1 for a detailed description)
To make the inertia emulation algorithm noise tolerant, a novel ramp rate control scheme is deployed. This scheme allows low frequency components of the speed feedback derivative to pass without phase shift, while heavily attenuating high frequency components of this signal, such as would result when taking the derivative of a noisy signal. To verify the noise immunity of the speed feedback derivative, the simulation includes noise in the speed feedback that would be equal to 1 part in 500 of RMS noise (i.e. a signal with approximately a 50 [db] signal to noise ratio, which is typical for these types of systems).
The fourth section of the OUTPUT stand torque regulator provides an additional torque reference that emulates the losses experienced by a moving vehicle due to 1st and 2nd order frictional effects, as well as the additional torque required to move the simulated vehicle up or down a slope. The algorithm used in the simulation was provided by the Terry Ledgerwood from Allsion Transmission. (see Chapter 1 for a detailed description)
Block Inputs:
[1] OUTPUT stand feed-forward torque reference [lb ft]
[2] OUTPUT stand torque feedback [lb ft]
[3] OUTPUT stand speed feedback [rpm]
Block Outputs:
[1] OUTPUT stand Motor torque [lb ft]
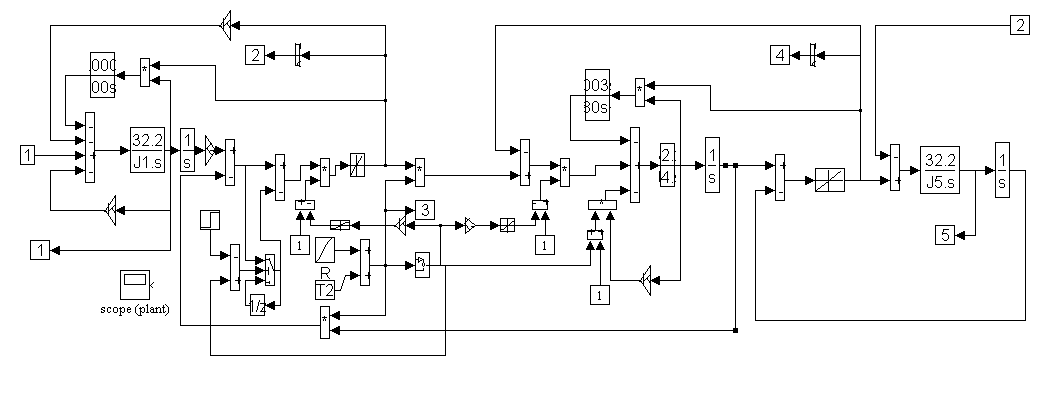
Figure 2-8. PLANT Main Block Diagram
PLANT block diagram description
The plant block diagram is somewhat involved. Briefly, it is composed of three main sub-systems:
- The INPUT stand motor, gear-box and load-cell model
- The Transmission model
- The OUTPUT stand motor and shaft spring model
The INPUT stand model
The INPUT stand model includes a viscous friction term, a high frequency damping term, and a look-up table that emulates the load-cell torque-deflection curve. See Chapter 1 for a more detailed description of the describing equations.
The Transmission model
The transmission model is the most complex part of the plant model. Several non-linear functions are deployed to enable the effective modeling of a transmission gear-shift. During a gear-shift the gears are de-coupled and re-coupled through some sort of a clutch mechanism. To avoid the need to model the entire transmission several assumptions were made in the modeling.
- The transmission gears de-couple within 50 - 100 [msec]. When this occurs, the inertial load on the engine is composed of only the engine and drive shaft inertia.
- The transmission gear change occurs within 500 [msec]
- Before the transmission gears re-engage, the gear-teeth speeds are approximately synchronized.
- A non-linear damping term is included on the output of the transmission. This term increases the damping as a function of the absolute value of the rate of change in an s-curve shaped gear-change (to approximate the damping effect of a clutch mechanism).
The OUTPUT stand model
The OUTPUT stand sub-system includes a viscous friction term, a high frequency damping term, and a look-up table that emulates the OUTPUT drive shaft torque-deflection curve. See Chapter 1 for a more detailed description of the describing equations.
Block Inputs:
[1] INPUT stand motor torque [lb ft]
[2] OUTPUT stand motor torque [lb ft]
Block Outputs:
[1] INPUT stand speed feedback [rpm]
[2] INPUT stand torque feedback [lb ft]
[3] Transmission gear-ratio [lb ft]
[4] OUTPUT stand torque feedback [lb ft]
[5] OUTPUT stand speed feedback [rpm]
CHAPTER 3
RESULTS
Introduction
The sets of plots following this introduction are presented in sub-sets each comprised of four plots. The four plots are:
- INPUT stand engine speed reference [rpm]/100 (green trace). Vehicle speed reference [mph] (red trace). Simulated grade reference [deg]x10 (blue trace)
- INPUT stand torque reference (after gear-box), and feedback [lb ft]
- INPUT stand (after gear-box, but before transmission) and OUTPUT stand speed feedbacks [rpm]
- OUTPUT stand shaft torque [lb ft]
Set-up Summary
The sets were run for the following sets of simulated vehicle/road conditions:
- Empty vehicle, no grade
- Empty vehicle 5 [deg] grade
- Full vehicle, no grade
- Full vehicle 5 [deg] grade
It was found that the engine model supplied for the simulation did not provide enough torque to accelerate a full vehicle to a speed of 50 [mph] (42,000 [lb], 5.38:1 differential gearing, 22 [in] wheels) up a slope of more than 5 [deg].
For each of the above, the following set of simulations were run:
- Changing transmission gears from low to high while accelerating
- Changing transmission gears from low to high while traveling at steady state
- Changing transmission gears from high to low while traveling at steady state
- Changing transmission gears from high to low while decelerating
A script file that describes the intialization of the simulations is included in Appendix A. For each test run, a test*.mat data file was saved, for the purpose of recovering simulation data at a later date.
Set (1.1):
Plots for test11.mat: Empty vehicle (EV), no grade (NG), changing transmission gears from low to high while accelerating.
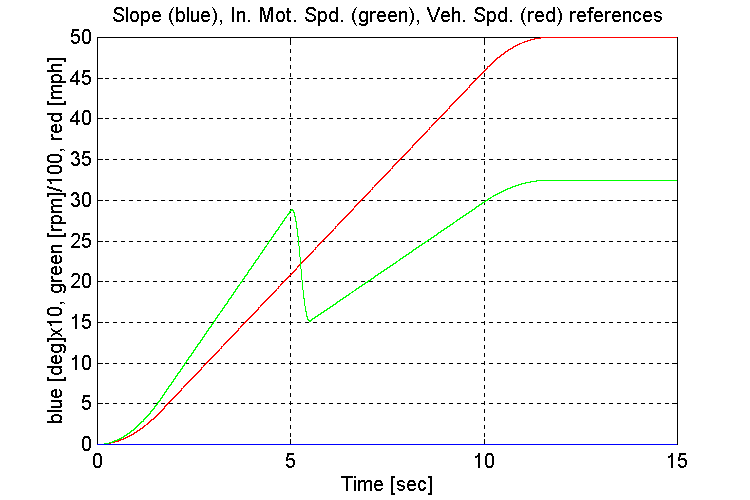
Figure 3-1 . Simulation references (EV, NG, L->H Accel)
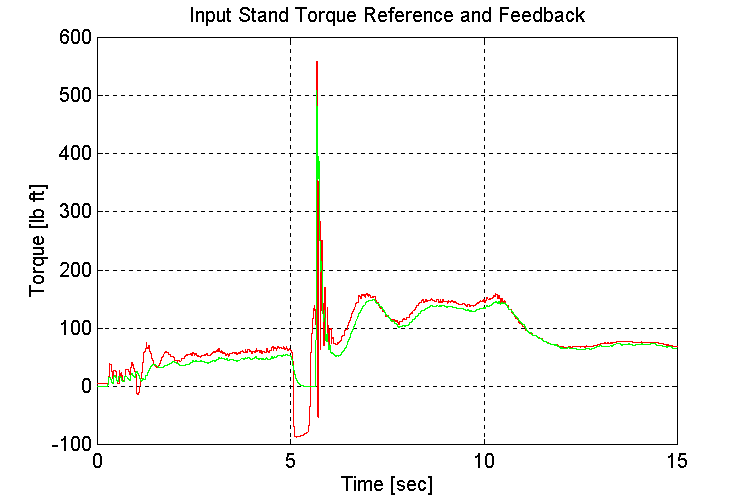
Figure 3-2 . Input torque ref. and fbk. [lb ft] (EV, NG, L->H Accel)
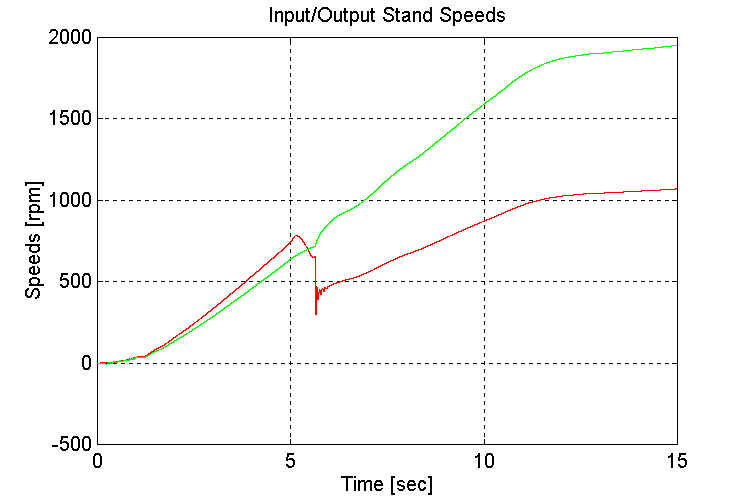
Figure 3-3 . Input and Output spd. Fbk. [rpm] (EV, NG, L->H Accel)
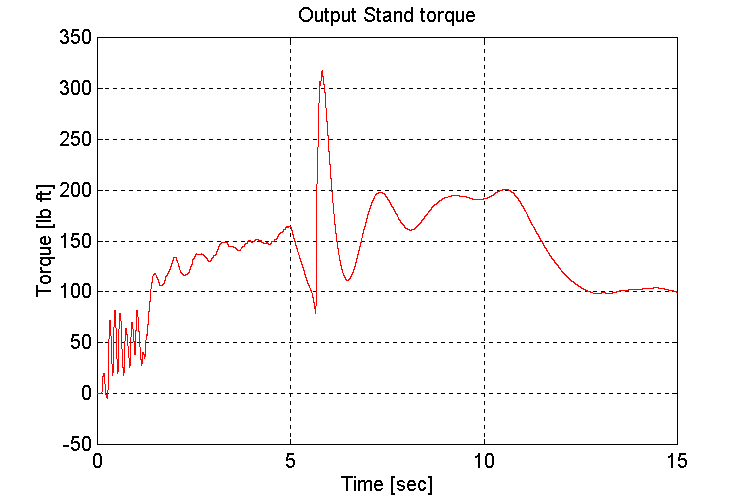
Figure 3-4 . Output stand shaft torque [lb ft] (EV, NG, L->H Accel)
Observations:
The amount and frequency of the low frequency under-damped response that is observed on INPUT and OUTPUT stand torques (Fig. 3-2,4) after the transmission shift occurs, is a function of the tuning of the engine model governor. It was found that a 1/3rd reduction in the proportional gain of the (Proprietary) regulator produced the most desirable response.
The Large spike in the input torque that occurs at the end of the transmission shift occurs in the simulation because of the method used to emulate the transmission gear-shift. Without an accurate model of the transmission, it is difficult to say with great certainty, how much of a shock the input and output shafts of the test stand will encounter when transmission gear-shifts occur on the completed test stand. It should not be worse than the simulation results, as there is no clutch modeled in the simulation.
Set (1.2):
Plots for test12.mat: Empty vehicle (EV), no grade (NG), Changing transmission gears from low to high while traveling at steady state
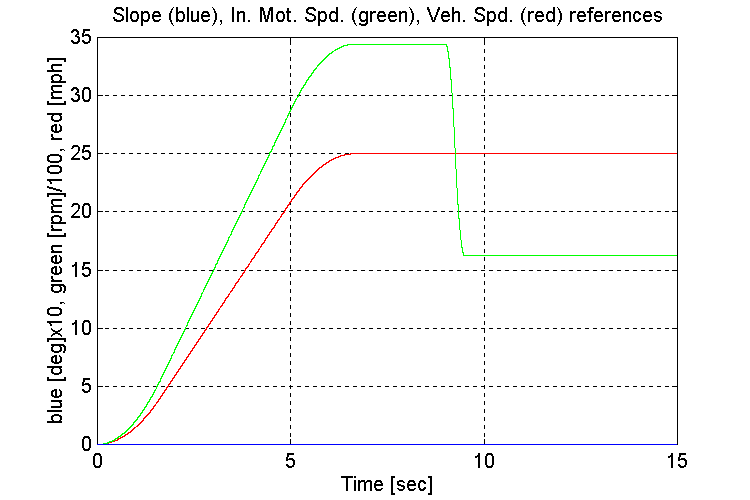
Figure 3-5 . Simulation references (EV, NG, L->H SS)
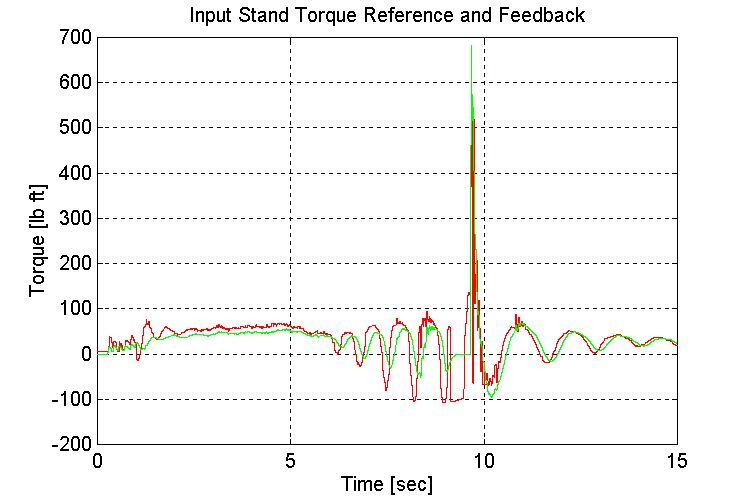
Figure 3-6 . Input torque ref. and fbk. [lb ft] (EV, NG, L->H SS)
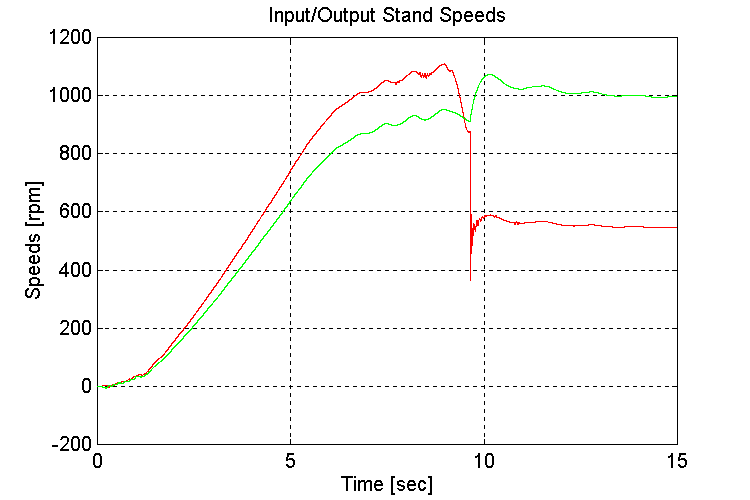
Figure 3-7 . Input and Output spd. Fbk. [rpm] (EV, NG, L->H SS)
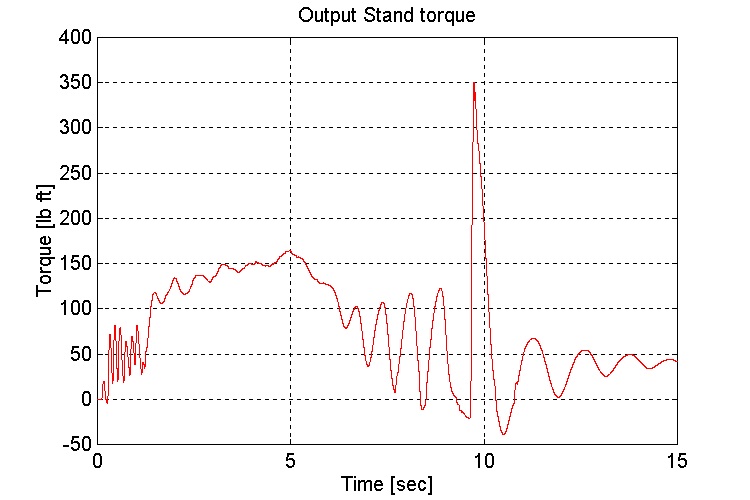
Figure 3-8 . Output stand shaft torque [lb ft] (EV, NG, L->H SS)
Observations:
When running under a light load, as is the case when using low-gear to accelerate, the engine model torque reference to the INPUT stand torque regulator exhibited instability (Fig. 3-6,8). This instability occurs as the engine model switches between the two inputs to the MIN/MAX block in the governor. The oscillations decreased once the gear shift occurred, and the INPUT stand torque requirement increased.
If the engine model that is supplied with the final sales order, is the same as that used in the simulation, it is recommended that the INPUT stand be adequately loaded to avoid the described instability.
Set (1.3):
Plots for test13.mat: Empty vehicle (EV), no grade (NG), Changing transmission gears from high to low while traveling at steady state
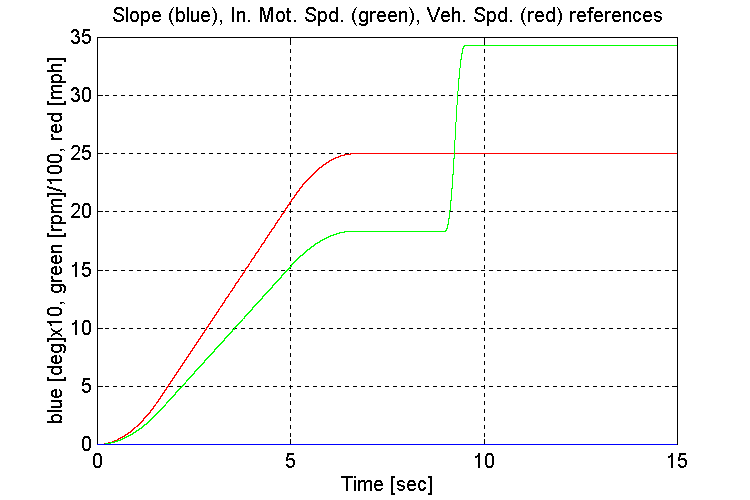
Figure 3-9 . Simulation references (EV, NG, H -> L SS)
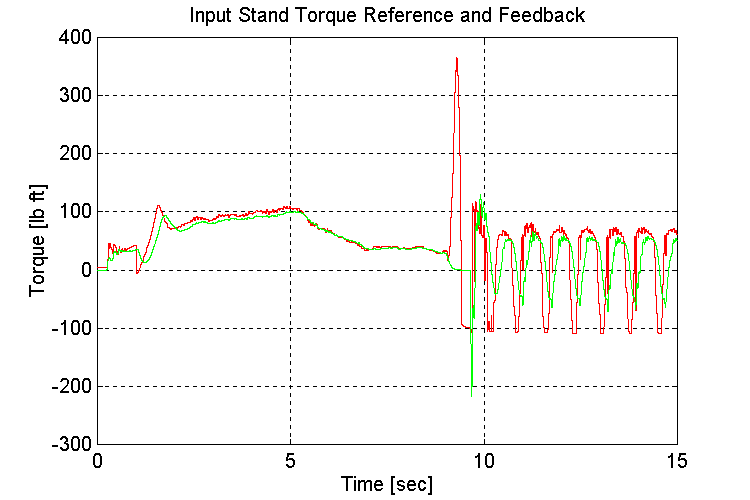
Figure 3-10 . Input torque ref. and fbk. [lb ft] (EV, NG, H -> L SS)
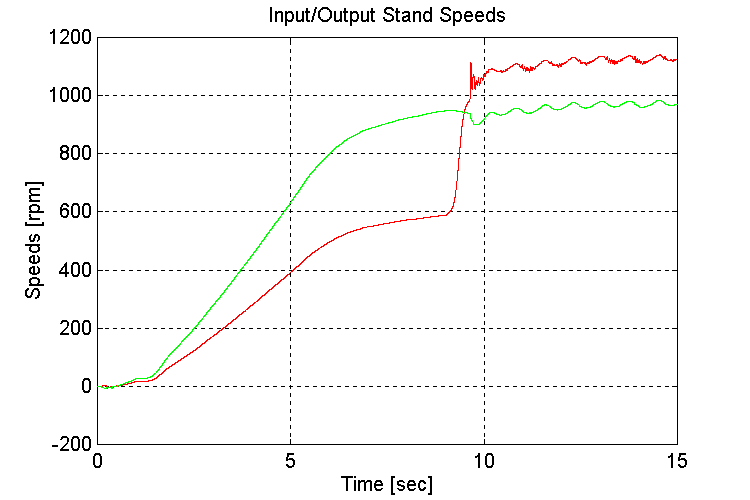
Figure 3-11 . Input and Output spd. Fbk. [rpm] (EV, NG, H -> L SS)
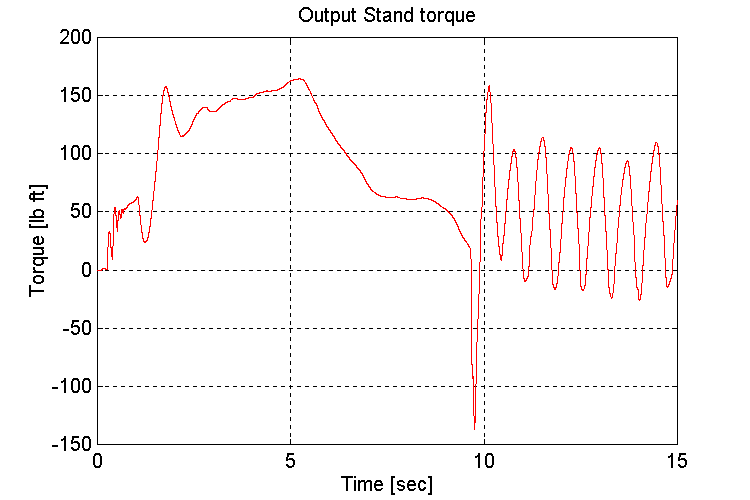
Figure 3-12 . Output stand shaft torque [lb ft] (EV, NG, H -> L SS)
Observations:
As was the case in the previous simulation, when running under a light load, the engine model torque reference to the INPUT stand torque regulator exhibited instability (Fig. 3-10,12). The oscillations began once the gear shift occurred from a high (i.e. high torque on the INPUT stand) to low (i.e. low torque on the input stand).
If the engine model that is supplied with the final sales order, is the same as that used in the simulation, it is recommended that the INPUT stand be adequately loaded to avoid the described instability.
Set (1.4):
Plots for test14.mat: Empty vehicle (EV), no grade (NG), Changing transmission gears from high to low while decelerating:
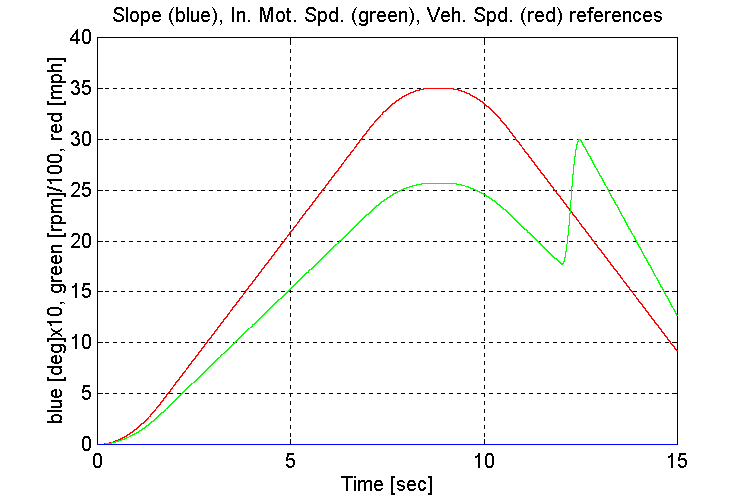
Figure 3-13 . Simulation references (EV, NG, H -> L Decel)
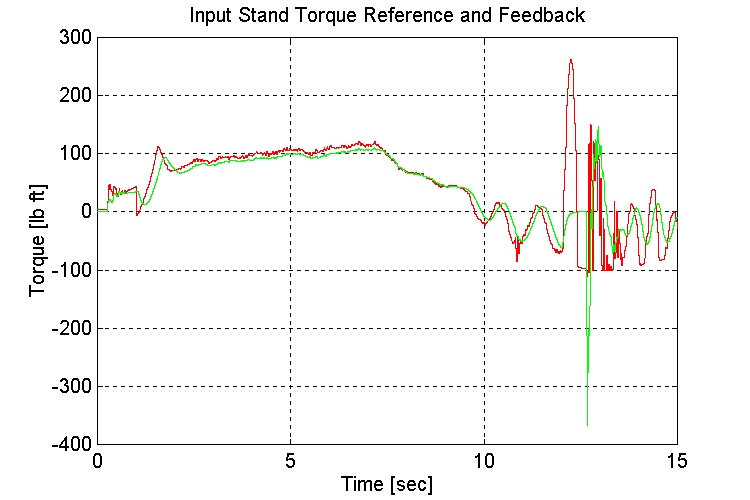
Figure 3-14 . Input torque ref. and fbk. [lb ft] (EV, NG, H -> L Decel)
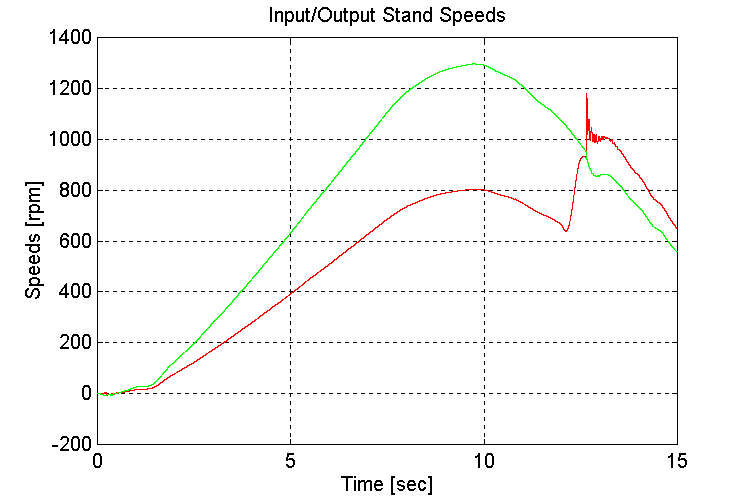
Figure 3-15 . Input and Output spd. Fbk. [rpm] (EV, NG, H -> L Decel)
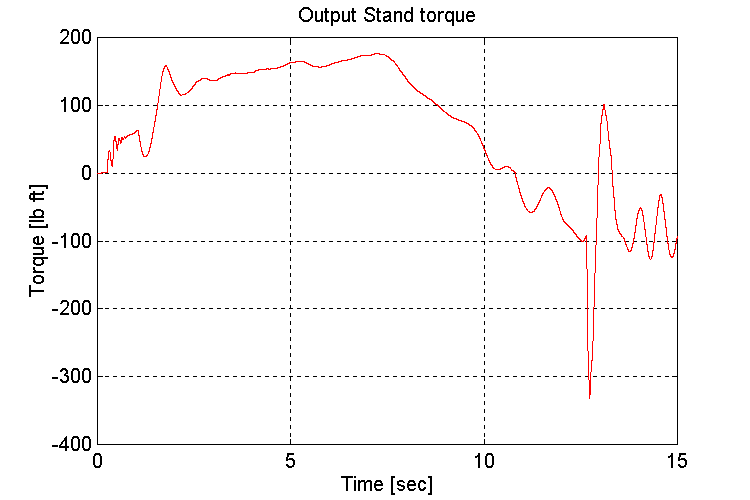
Figure 3-16 . Output stand shaft torque [lb ft] (EV, NG, H -> L Decel)
Observations:
Same as for Sets (1.2,3)
Set (2.1):
Plots for test21.mat: Empty vehicle (EV), 5 [deg] grade (G), changing transmission gears from low to high while accelerating.
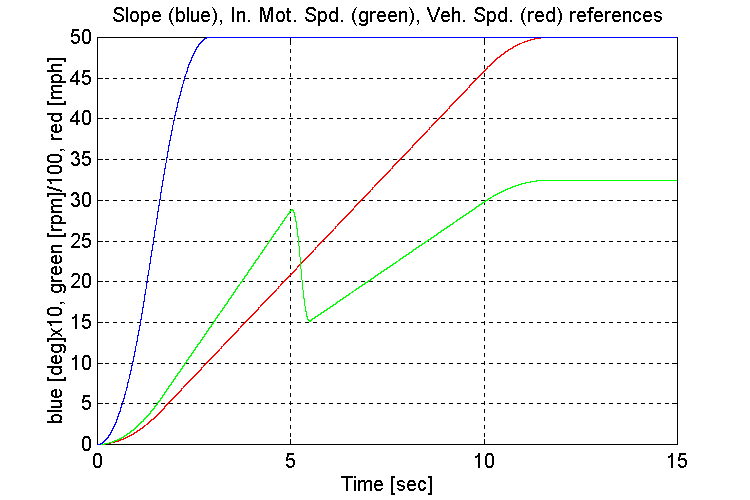
Figure 3-17 . Simulation references (EV, G, L->H Accel)
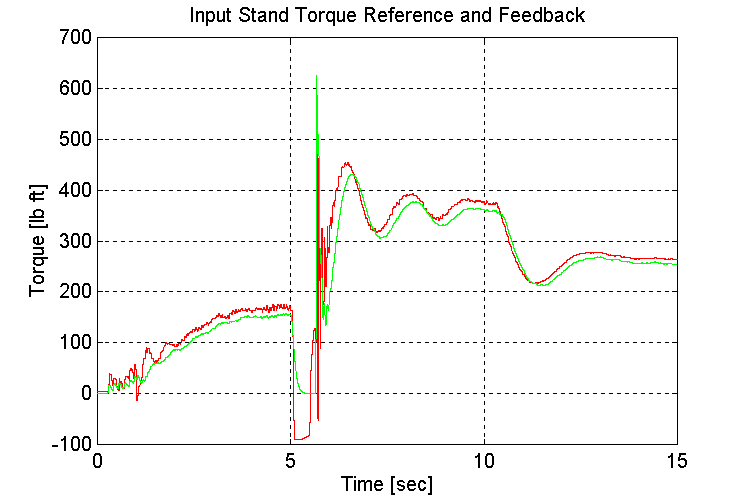
Figure 3-18 . Input torque ref. and fbk. [lb ft] (EV, G, L->H Accel)
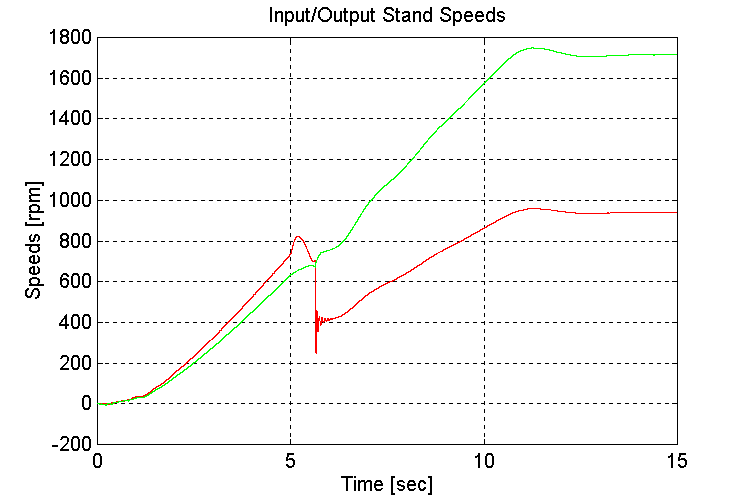
Figure 3-19 . Input and Output spd. Fbk. [rpm] (EV, G, L->H Accel)
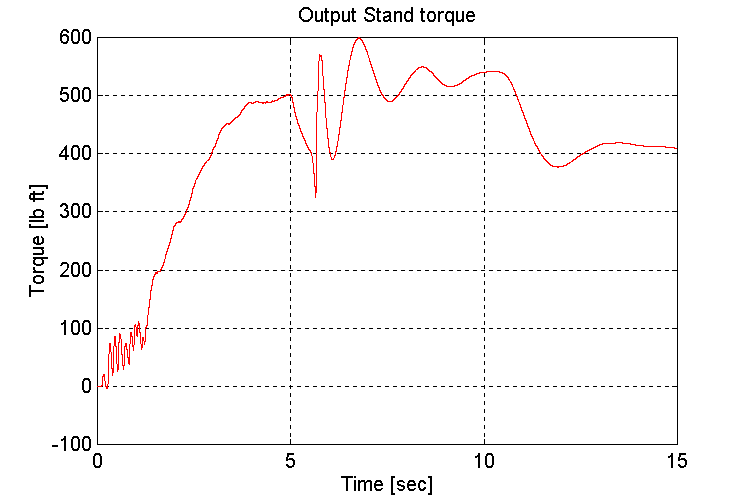
Figure 3-20 . Output stand shaft torque [lb ft] (EV, G, L->H Accel)
Observations:
As observed in set (1.1) the amount and frequency of the low frequency under-damped response that is observed on INPUT and OUTPUT stand torques (Fig. 3-18,20) after the transmission shift occurs, is a function of the tuning of the engine model governor. A 1/3rd reduction in the proportional gain of the PD regulator produced the most desirable response.
Set (2.2):
Plots for test22.mat: Empty vehicle (EV), 5 [deg] grade (G), Changing transmission gears from low to high while traveling at steady state
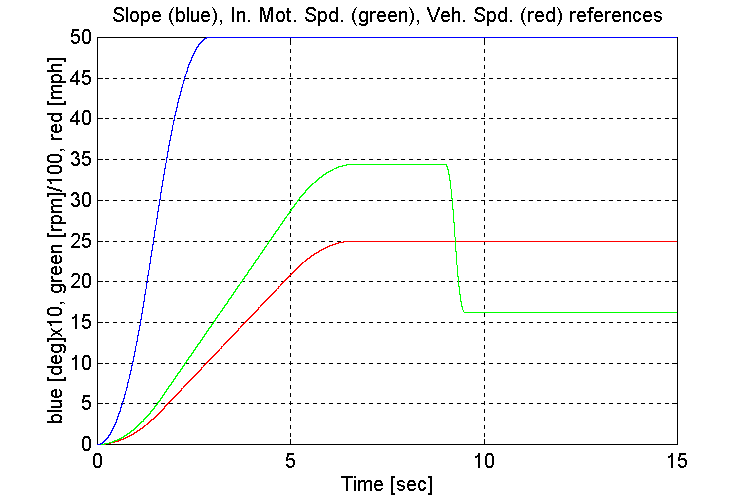
Figure 3-21 . Simulation references (EV, G, L->H SS)
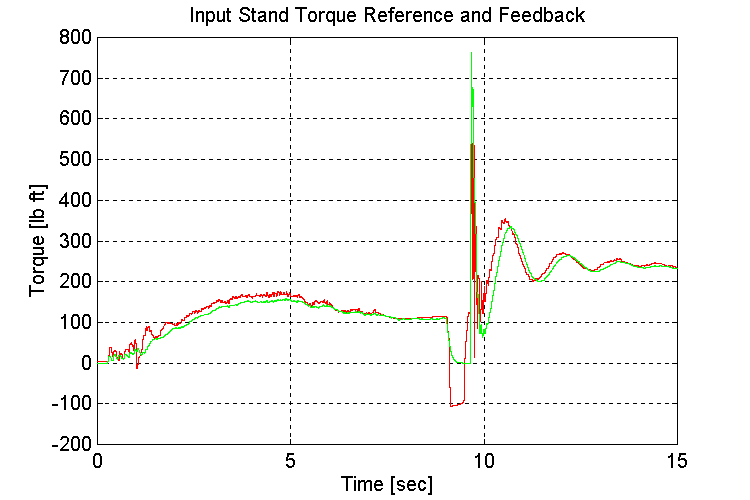
Figure 3-22 . Input torque ref. and fbk. [lb ft] (EV, G, L->H SS)
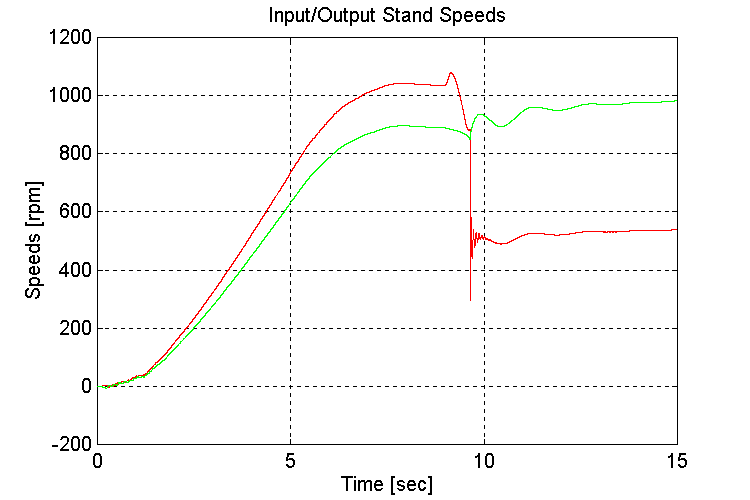
Figure 3-23 . Input and Output spd. Fbk. [rpm] (EV, G, L->H SS)
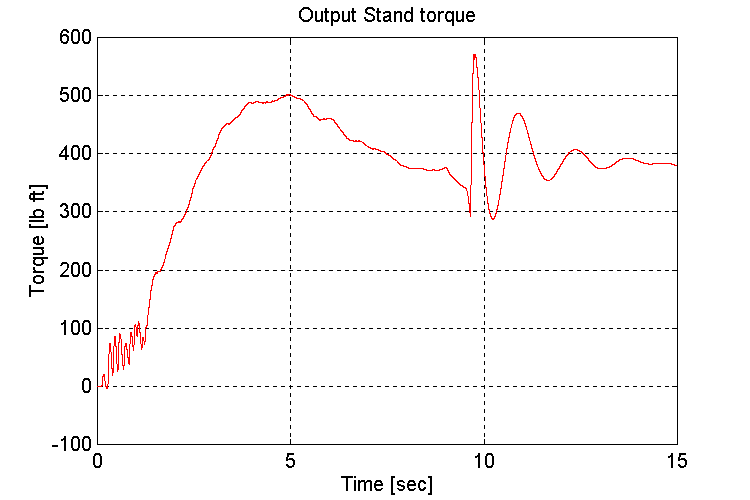
Figure 3-24 . Output stand shaft torque [lb ft] (EV, G, L->H SS)
Observations:
Same as for set (2.1)
Set (2.3):
Plots for test23.mat: Empty vehicle (EV), 5 [deg] grade (G), Changing transmission gears from high to low while traveling at steady state
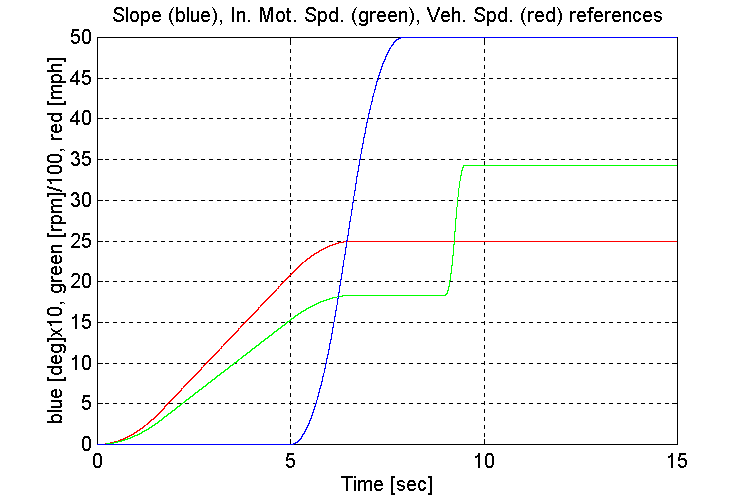
Figure 3-25 . Simulation references (EV, G, H -> L SS)
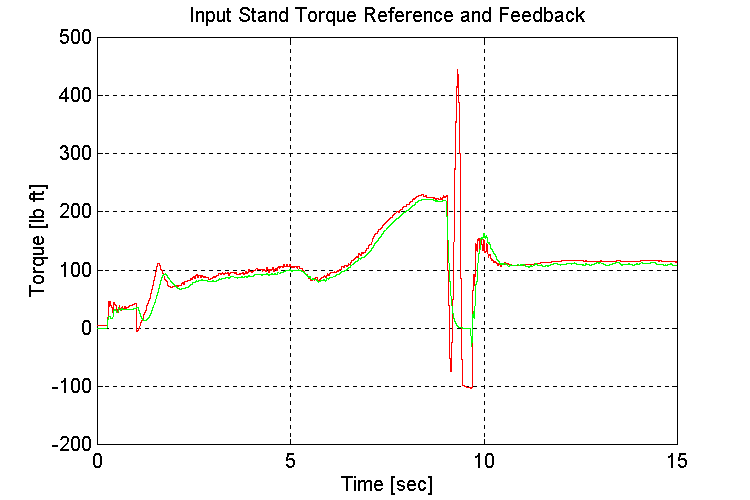
Figure 3-26 . Input torque ref. and fbk. [lb ft] (EV, G, H -> L SS)
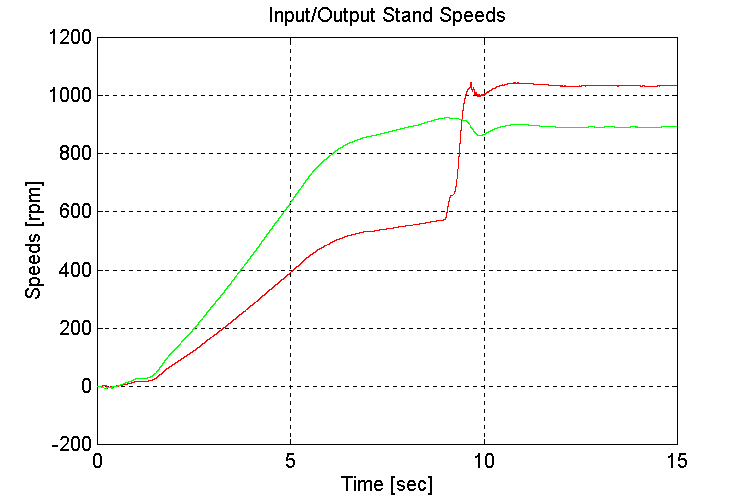
Figure 3-27 . Input and Output spd. Fbk. [rpm] (EV, G, H -> L SS)
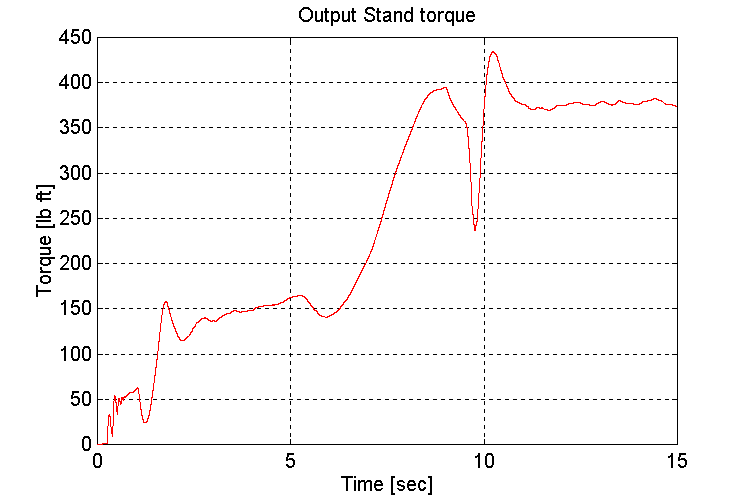
Figure 3-28 . Output stand shaft torque [lb ft] (EV, G, H -> L SS)
Observations:
Same as for set (2.1,2)
Set (2.4):
Plots for test24.mat: Empty vehicle (EV), 5 [deg] grade (G), Changing transmission gears from high to low while decelerating:
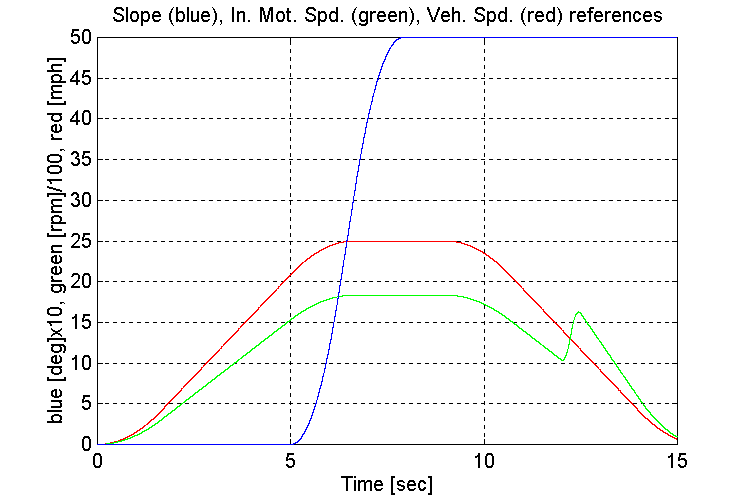
Figure 3-29 . Simulation references (EV, G, H -> L Decel)
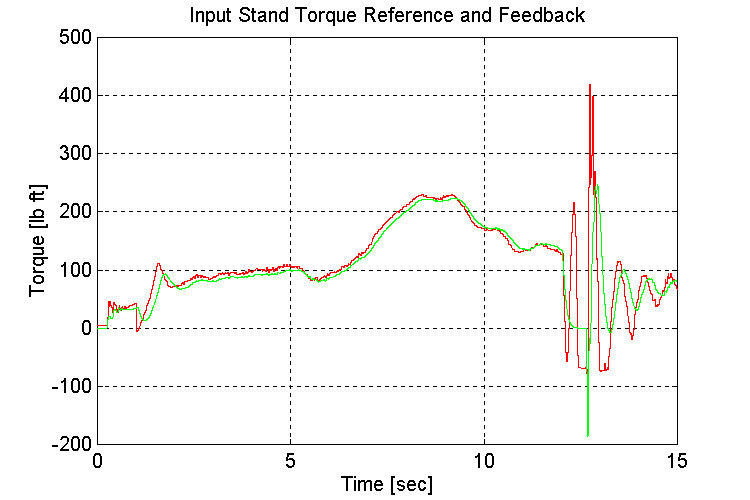
Figure 3-30 . Input torque ref. and fbk. [lb ft] (EV, G, H -> L Decel)
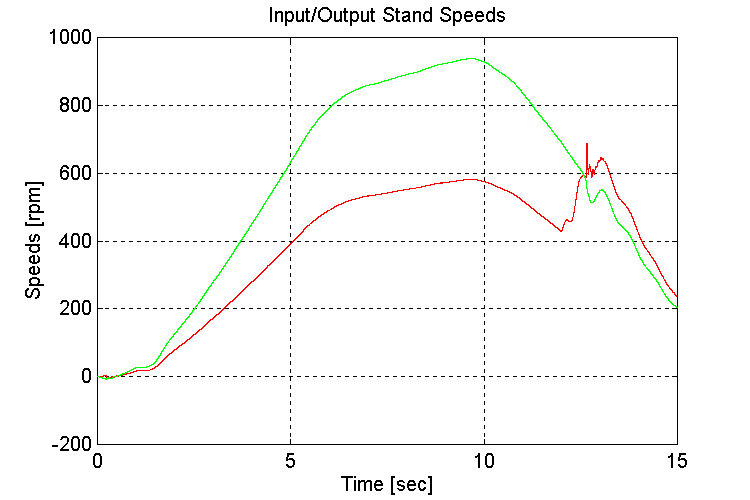
Figure 3-31 . Input and Output spd. Fbk. [rpm] (EV, G, H -> L Decel)
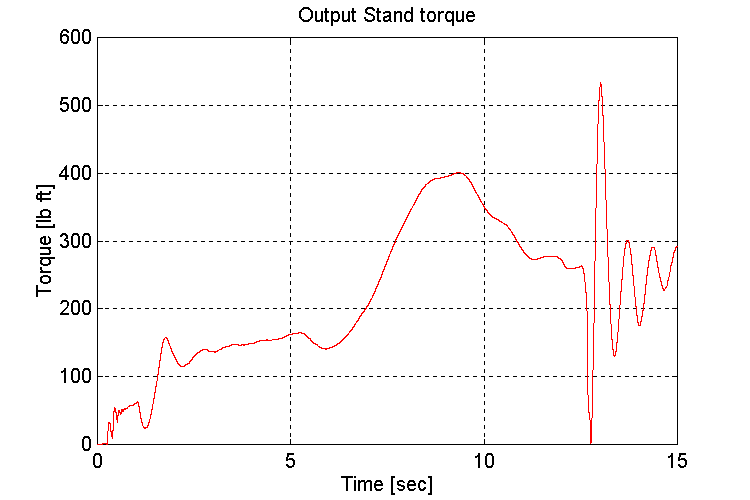
Figure 3-32 . Output stand shaft torque [lb ft] (EV, G, H -> L Decel)
Observations:
As observed in previous simulations, when running under a light load, the engine model torque reference to the INPUT stand torque regulator exhibits instability (Fig. 3-30,32). This instability occurs as the engine model switches between the two inputs to the MIN/MAX block in the governor. The oscillations began once the gear shift from a high to low gear occurred, during the deceleration.
Set (3.1):
Plots for test31.mat: Full vehicle (FV), no grade (NG), changing transmission gears from low to high while accelerating.
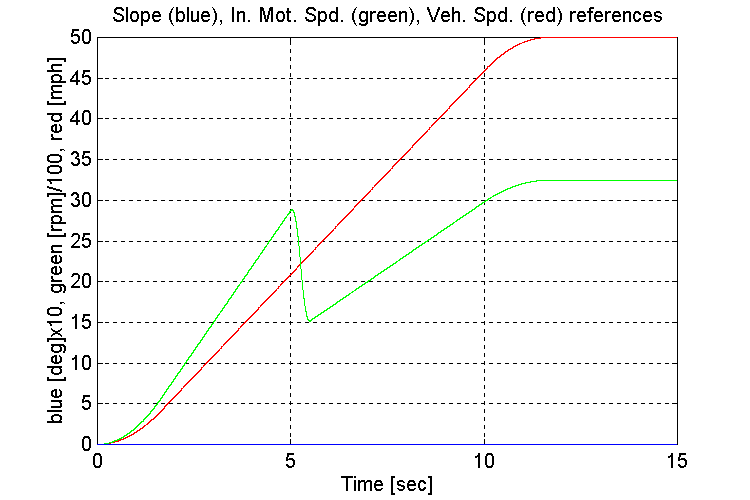
Figure 3-33 . Simulation references (FV, NG, L->H Accel)
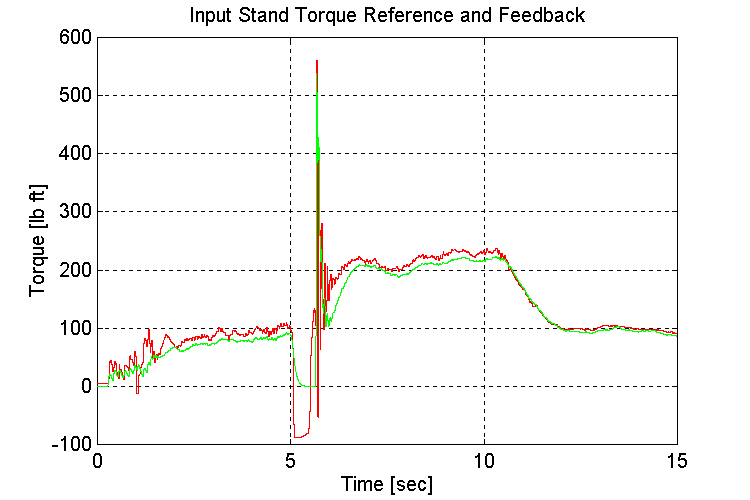
Figure 3-34 . Input torque ref. and fbk. [lb ft] (FV, NG, L->H Accel)
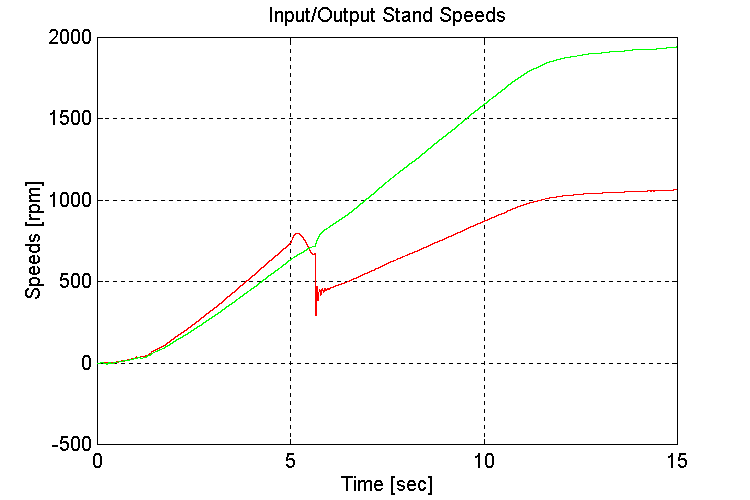
Figure 3-35 . Input and Output spd. Fbk. [rpm] (FV, NG, L->H Accel)
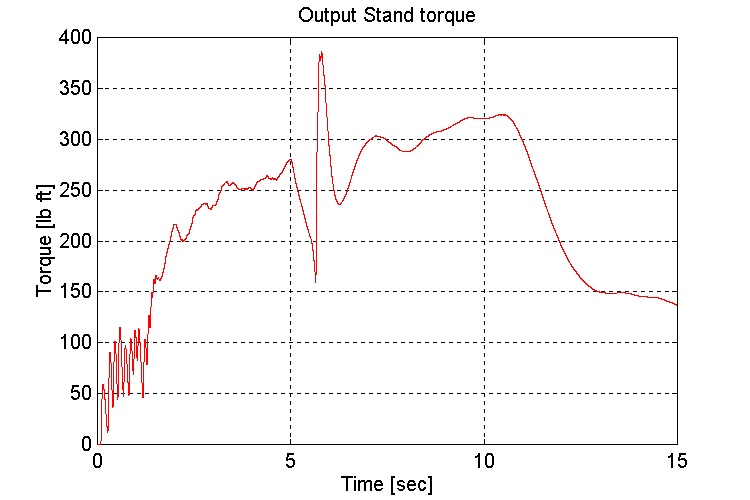
Figure 3-36 . Output stand shaft torque [lb ft] (FV, NG, L->H Accel)
Observations:
Same as for Sets (1.1,2)
Set (3.2):
Plots for test32.mat: Full vehicle (FV), 5 [deg] grade (G), Changing transmission gears from low to high while traveling at steady state
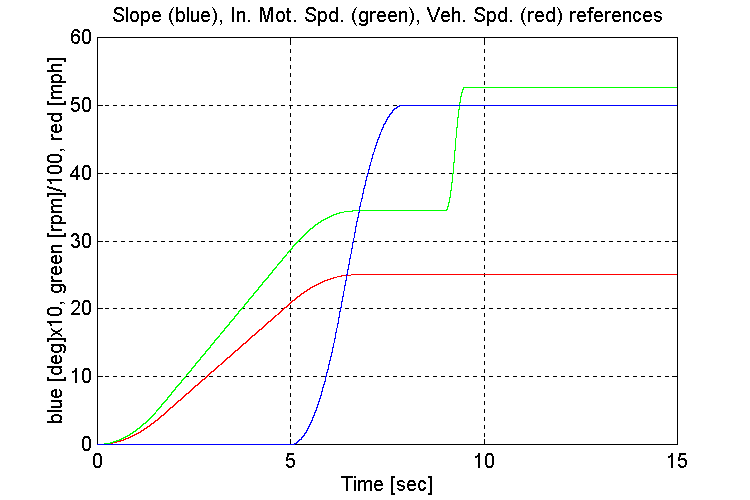
Figure 3-37 . Simulation references (FV, G, L->H SS)
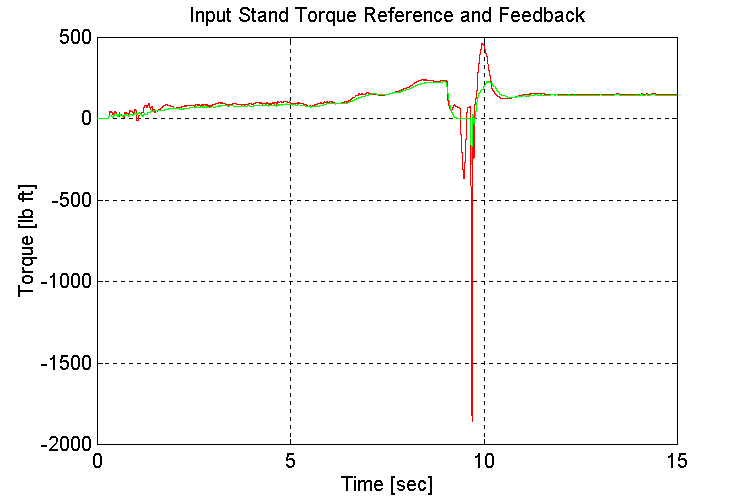
Figure 3-38 . Input torque ref. and fbk. [lb ft] (FV, G, L->H SS)
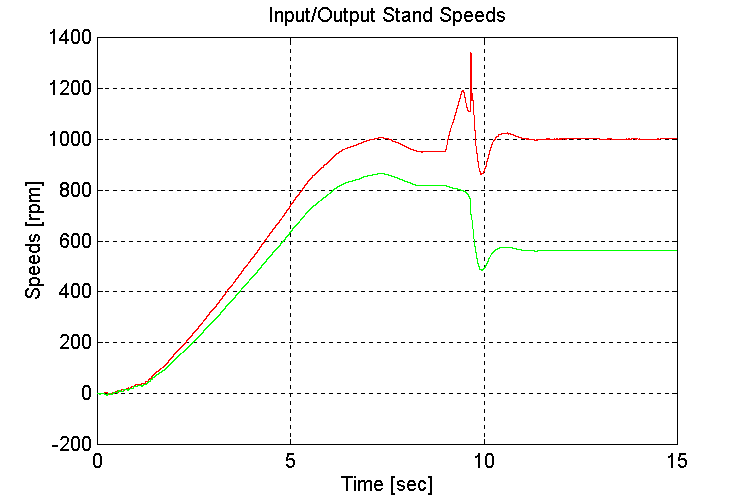
Figure 3-39 . Input and Output spd. Fbk. [rpm] (FV, G, L->H SS)
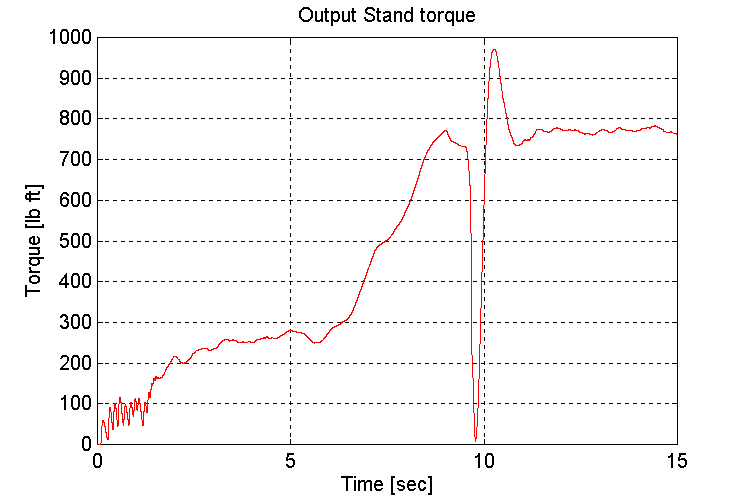
Figure 3-40 . Output stand shaft torque [lb ft] (FV, G, L->H SS)
Observations:
To avoid running into a torque limit, the grade was introduced after the vehicle reached set-point speed.
Set (3.3):
Plots for test33.mat: Full vehicle (FV), no grade (NG), Changing transmission gears from high to low while traveling at steady state
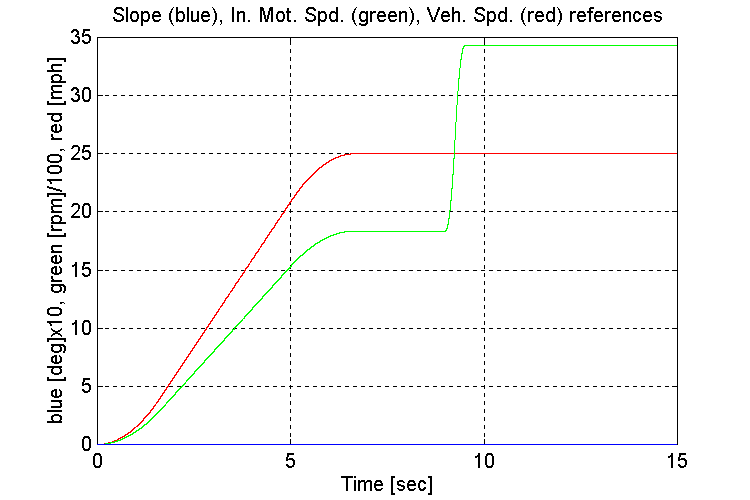
Figure 3-41 . Simulation references (FV, NG, H -> L SS)
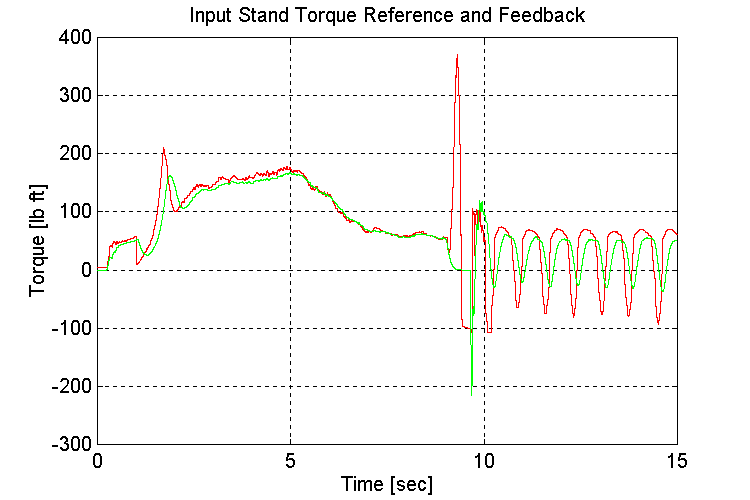
Figure 3-42 . Input torque ref. and fbk. [lb ft] (FV, NG, H -> L SS)
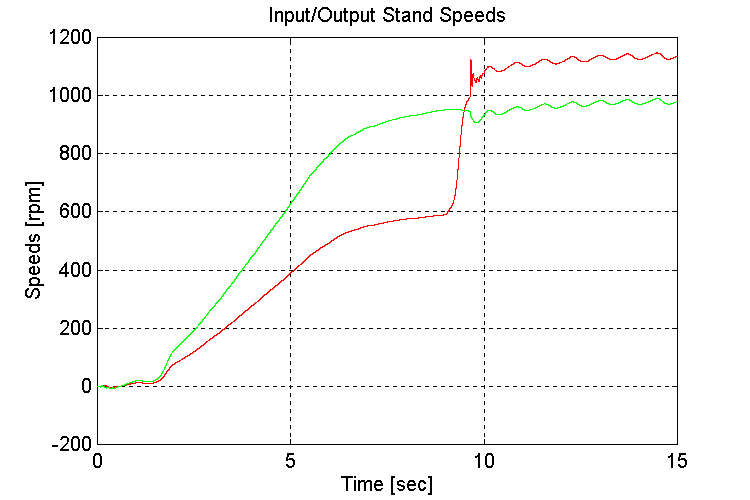
Figure 3-43 . Input and Output spd. Fbk. [rpm] (FV, NG, H -> L SS)
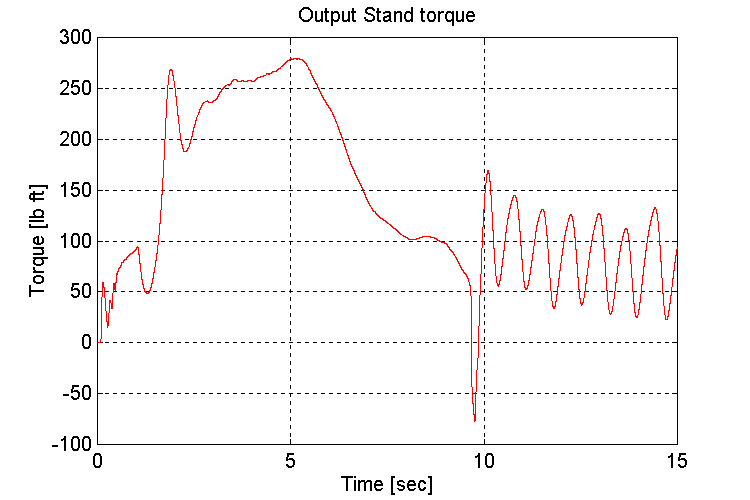
Figure 3-44 . Output stand shaft torque [lb ft] (FV, NG, H -> L SS)
Observations:
As observed previously, when running under a light load, the engine model torque reference to the INPUT stand torque regulator exhibited instability (Fig. 3-42,44). This instability occurs as the engine model switches between the two inputs to the MIN/MAX block in the governor. The oscillations began once the gear shift occurred, and the INPUT stand torque requirement decreased.
P ALIGN="JUSTIFY">Set (3.4):
Plots for test34.mat: Full vehicle (FV), no grade (NG), Changing transmission gears from high to low while decelerating:
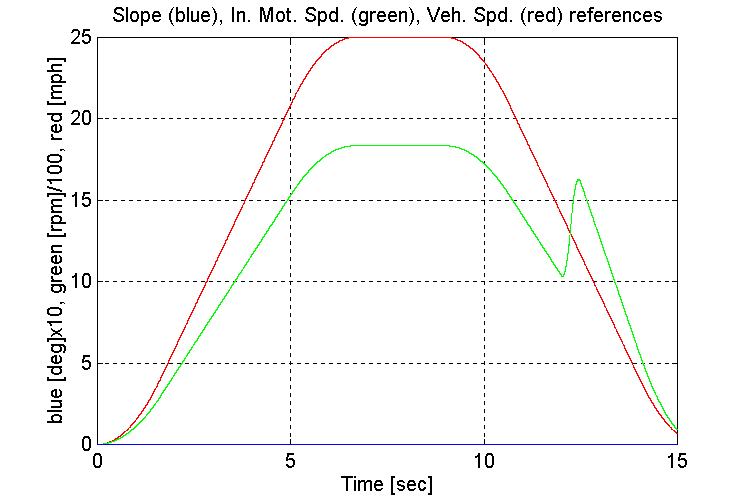
Figure 3-45 . Simulation references (FV, NG, H -> L Decel)
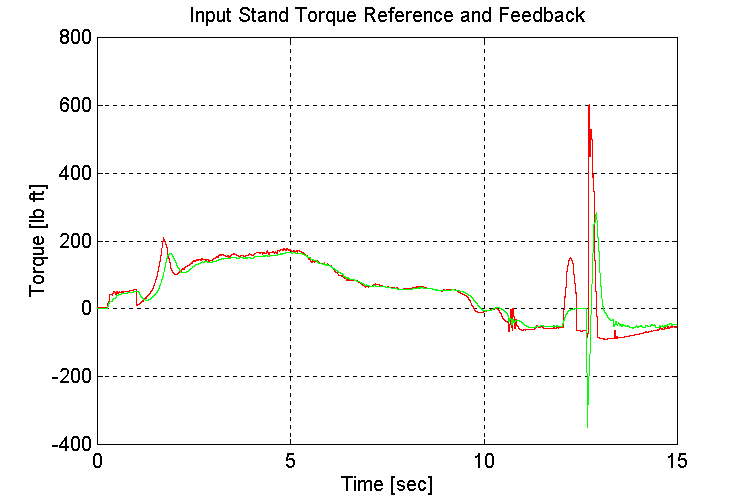
Figure 3-46 . Input torque ref. and fbk. [lb ft] (FV, NG, H -> L Decel)
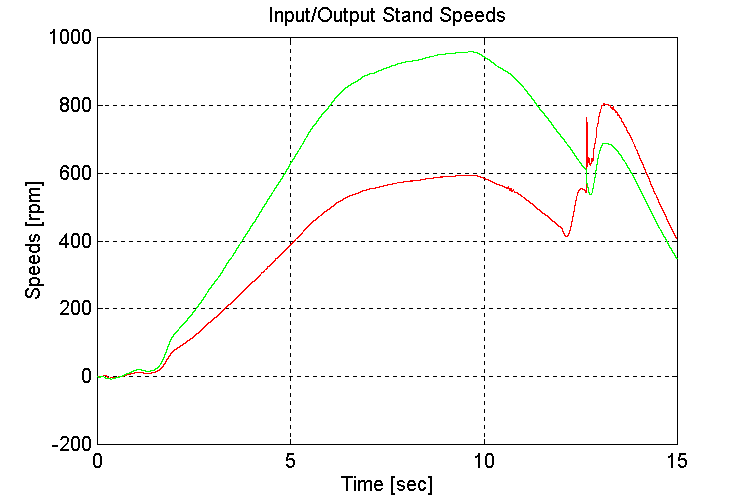
Figure 3-47 . Input and Output spd. Fbk. [rpm] (FV, NG, H -> L Decel)
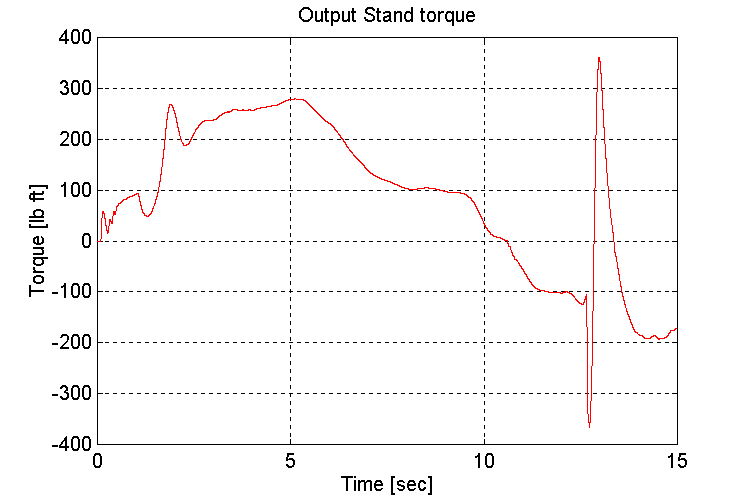
Figure 3-48 . Output stand shaft torque [lb ft] (FV, NG, H -> L Decel)
Observations:
When loaded, and regulating speed, the engine model is satisfactory stable.
Set (4.1):
Plots for test41.mat: Full vehicle (FV), 5 [deg] grade (G), could not change transmission gears while accelerating. (Not enough HP in engine model to change transmission gears during acceleration, the engine stalled)
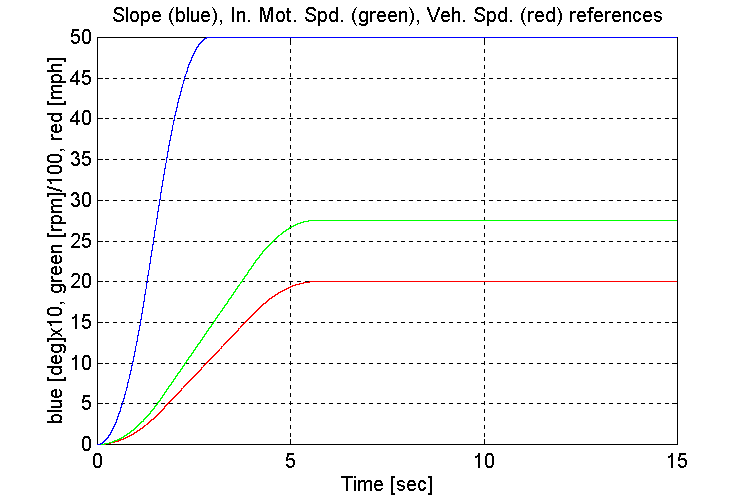
Figure 3-49 . Simulation references (FV, G, L->H Accel)
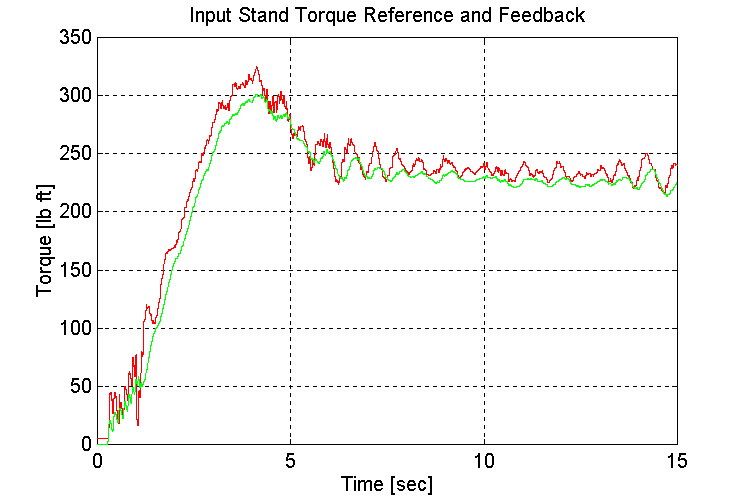
Figure 3-50 . Input torque ref. and fbk. [lb ft] (FV, G, L->H Accel)
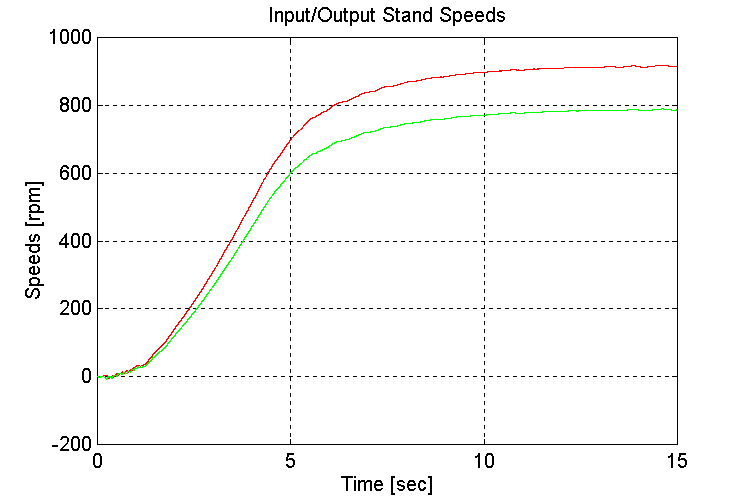
Figure 3-51 . Input and Output spd. Fbk. [rpm] (FV, G, L->H Accel)
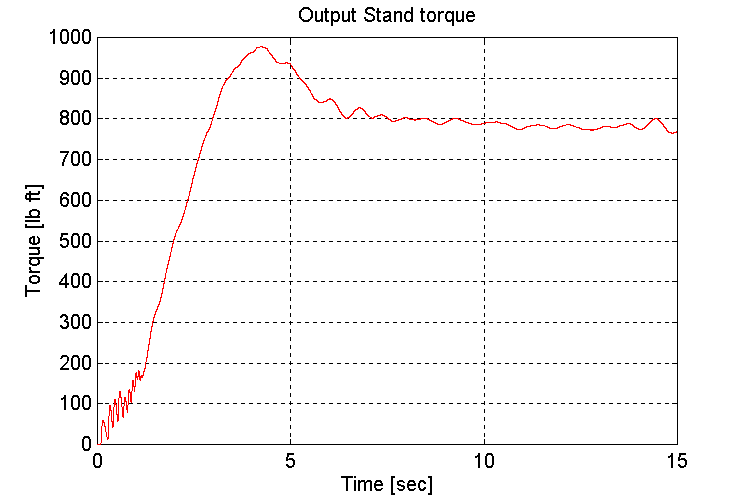
Figure 3-52 . Output stand shaft torque [lb ft] (FV, G, L->H Accel)
Observations:
In this simulation, with a simulated full vehicle, the slope was introduced at the beginning of the run. It was found that if the gears were shifted from low to high during an acceleration, the motor would stall. Therefore a gear shift was not programmed in this simulation.
Set (4.2):
Plots for test42.mat: Full vehicle (FV), 5 [deg] grade (G), Changing transmission gears from low to high while traveling at steady speed (25 [mph]).
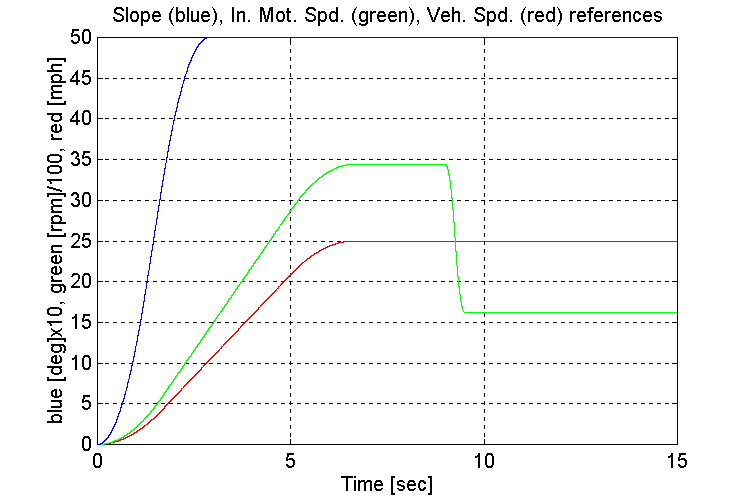
Figure 3-53 . Simulation references (FV, G, L->H SS)
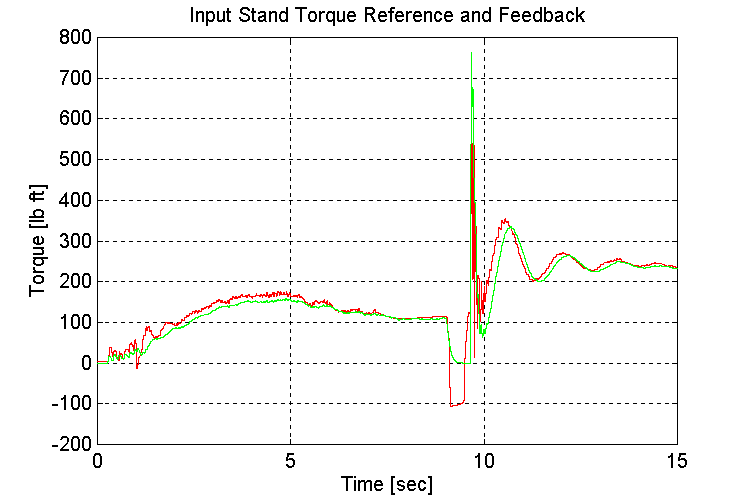
Figure 3-54 . Input torque ref. and fbk. [lb ft] (FV, G, L->H SS)
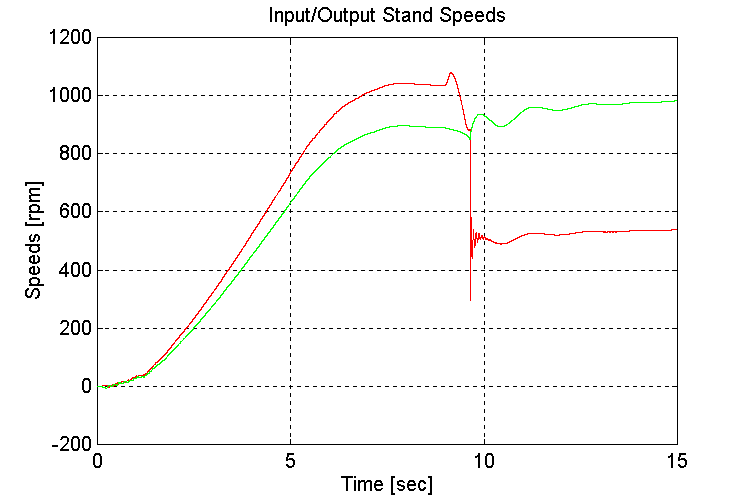
Figure 3-55 . Input and Output spd. Fbk. [rpm] (FV, G, L->H SS)
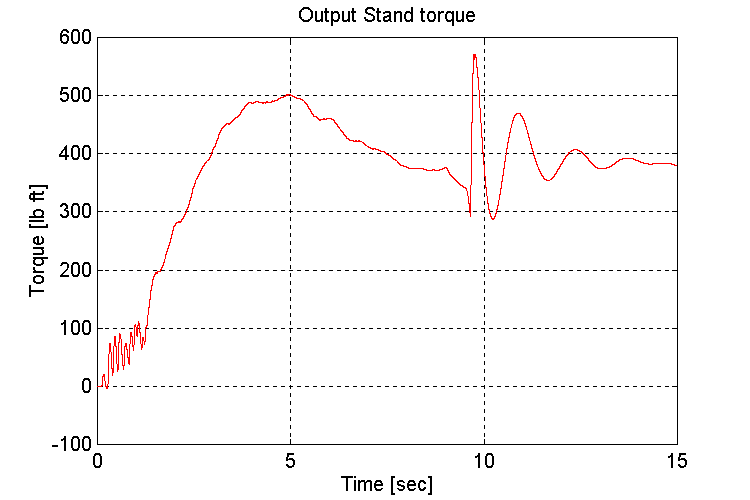
Figure 3-56 . Output stand shaft torque [lb ft] (FV, G, L->H SS)
Observations:
As observed previously, the amount and frequency of the low frequency under-damped response that is observed on INPUT and OUTPUT stand torques (Fig. 3-54,56) after the transmission shift occurs, is a function of the tuning of the engine model governor. A 1/3rd reduction in the proportional gain of the PD regulator produced the most desirable response.
Set (4.3):
Plots for test43.mat: Full vehicle (FV), 5 [deg] grade (G), Changing transmission gears from high to low while traveling at steady state
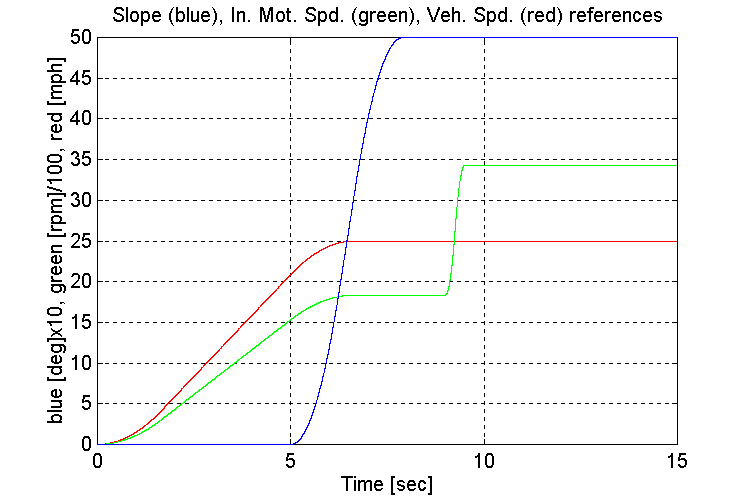
Figure 3-57 . Simulation references (FV, G, H -> L SS)
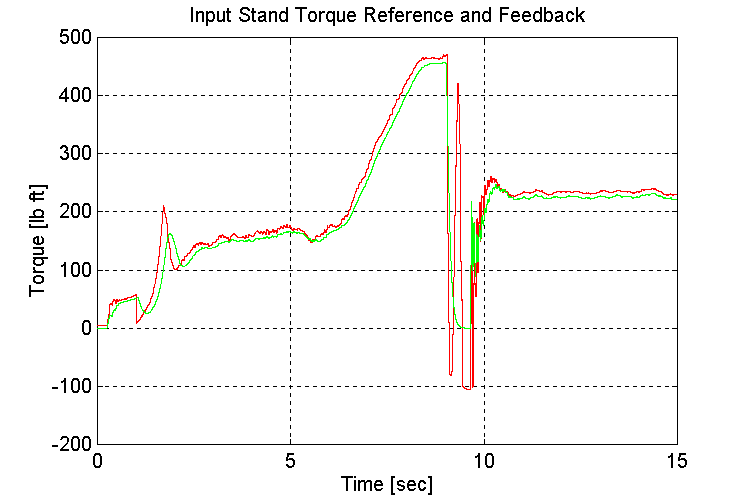
Figure 3-58 . Input torque ref. and fbk. [lb ft] (FV, G, H -> L SS)
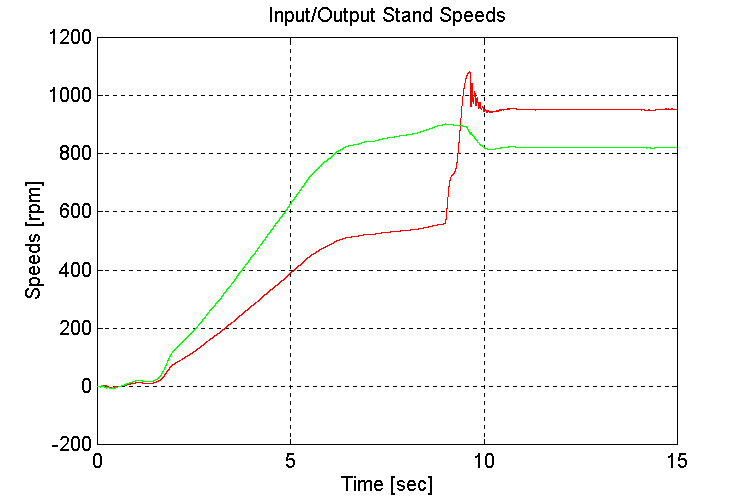
Figure 3-59 . Input and Output spd. Fbk. [rpm] (FV, G, H -> L SS)
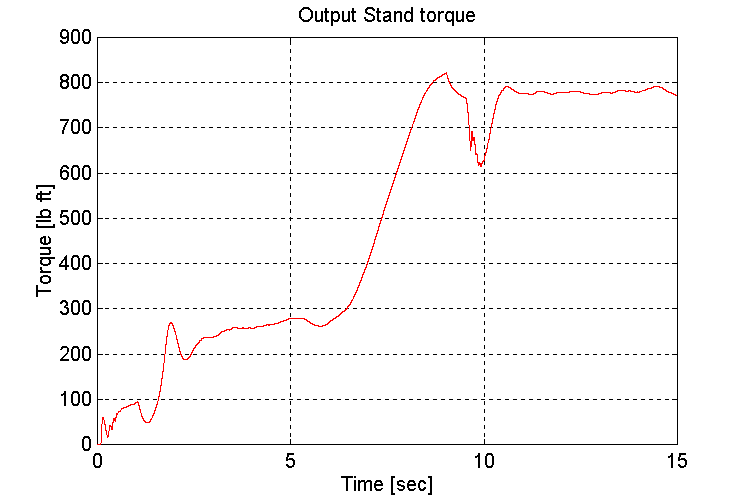
Figure 3-60 . Output stand shaft torque [lb ft] (FV, G, H -> L SS)
Observations:
The slope was introduced after the vehicle had accelerated. This was to avoid stalling the engine during the acceleration phase. After the gear-shift, the torque output of the engine model did reach a maximum however, and the vehicle did not reach its set-point speed.
Another observation of interest is that the response of the speed regulator is significantly more sluggish when the vehicle is loaded, and accelerating up a slope.
Set (4.4):
Plots for test44.mat: Full vehicle (FV), 5 [deg] grade (G), Changing transmission gears from high to low while decelerating:
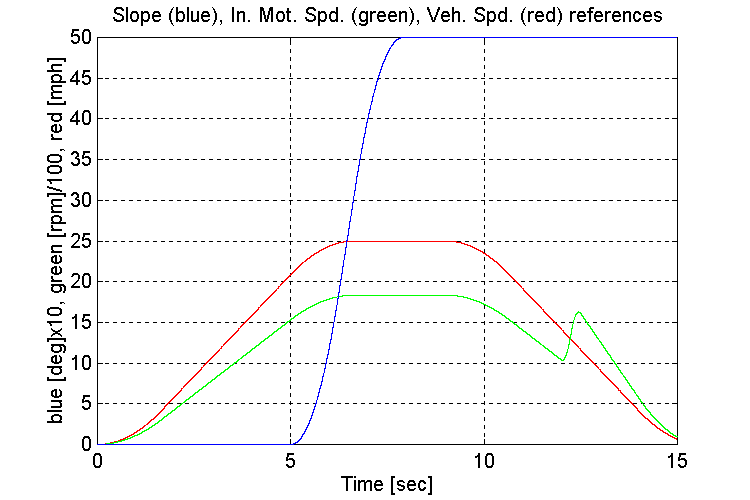
Figure 3-61 . Simulation references (FV, G, H -> L Decel)
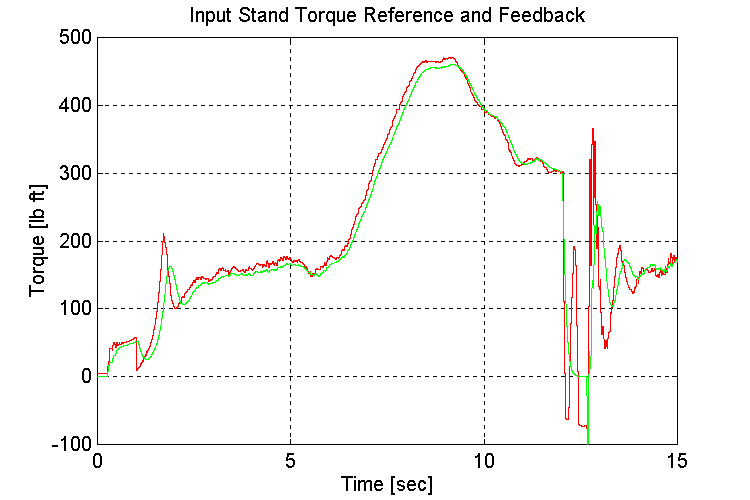
Figure 3-62 . Input torque ref. and fbk. [lb ft] (FV, G, H -> L Decel)
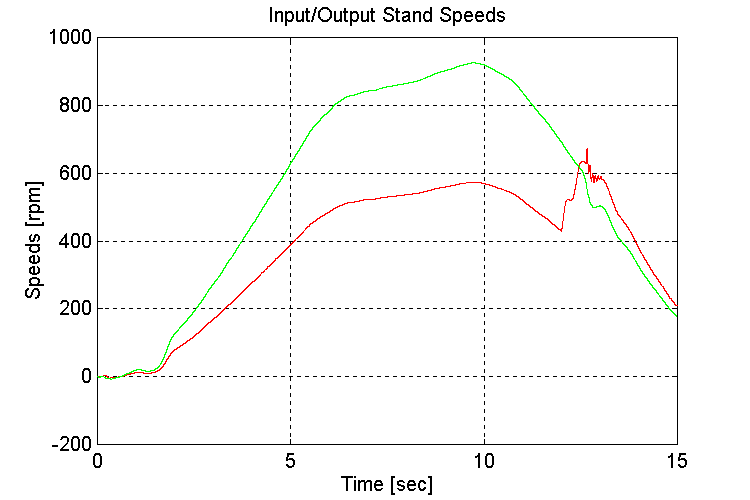
Figure 3-63 . Input and Output spd. Fbk. [rpm] (FV, G, H -> L Decel)
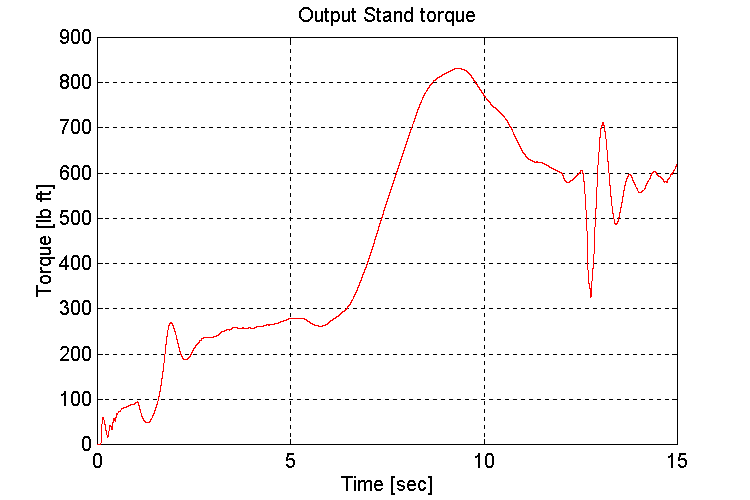
Figure 3-64 . Output stand shaft torque [lb ft] (FV, G, H -> L Decel)
Observations:
As in set (4.3) The slope was introduced after the vehicle had accelerated. This was to avoid stalling the engine during the acceleration phase.
Another observation of interest is that the response of the speed regulator is significantly more sluggish when the vehicle is loaded, and accelerating up a slope. The bandwidth of the speed regulator improved after the gear-shift from high to low gear occurred.
CHAPTER 4
CONCLUSIONS AND RECOMMENDATIONS
Conclusions
The following conclusions were drawn from the exercise of modeling, and simulating the proposed mechanical and electrical system.
- The engine model exhibits instability when required to regulate a given speed [rpm] with a relatively low torque.
- The tuning of the governor in the engine model may require some adjustment during start-up. To obtain the best speed regulation in the simulation, the Proportional term of the governor regulator was changed from 0.0009616 to 0.003 in the simulation. The derivative gains of the regulator and the D speed feed-back fuel-rate feed-forward regulator were not changed.
- The engine model will stall, if a given test set-up requires performance outside the particular engine modelís torque-speed envelope.
- The resonance compensation circuit was sufficiently robust to enable the prescribed tuning for an empty vehicle to work adequately with a full vehicle. If there are significant changes in the simulated vehicle mass, resulting in a significant change in the dominant natural frequency of the closed-loop test stand set-up, set-up dependant tuning parameters for the RES-COMP filter will be required.
- The noise sensitivity of the derivative of the speed feedback was significantly enhanced by deploying the rate controlled ramp function on the speed derivative.
- The inertia emulation algorithm on the OUTPUT stand performed very well.
- The engine inertia emulation algorithm on the INPUT stand also performed well during reasonable rate changes in speed. The speed deviations caused by the torque spikes on the INPUT stand that occurred when the simulated transmission gears re-engaged, were also compensated for. However, the response of the inertia emulation circuit was not fast enough to completely isolate the input shaft of the transmission from the higher reflected electric motor inertia during these changes. It is expected that the actual shaft torque excursions during transmission gear-changes will be somewhat less than the observed deviations in the simulation, resulting in better inertia emulation than that which was observed in the simulation.
- The road-load model produced very convincing road-load conditions. The equations provided enough adjustments to create any desired loading conditions on the transmission.
Recommendations
The following recommendations are the result of taking into consideration the above conclusions, and discussions with several Systems Engineers at the Drive Vendor.
- The simplified engine model used in the simulation can easily be implemented in an appropriate DCS processor with a combination of functions and/or high level language code. A single separate processor should be scheduled to perform all the engine modeling tasks.
- The INPUT and OUTPUT regulators should be scheduled in a processor that is in the same rack as the processor containing the tasks with the engine model.
- A recipe based level 2 set-up interface will be required. The recipe should download engine model data, INPUT and OUTPUT stand tuning and calibration data, and the appropriate sequencing to perform the desired road-load emulation for a given test.
- Care should be taken to ensure that the parameters of the transmission tests that are in the recipe do not require the engine model used in the tests to perform outside the design speed-torque envelope of the engine that is being emulated. This is to avoid stalling the test set-up.
- Care should also be taken to ensure that the transmission test set-ups are devised to regulate a given speed with sufficiently high torque. This is to avoid the governor regulator instability that can be seen in sets (1.2,3) for example.
This concludes the engineering report.
BIBLIOGRAPHY
[1] Proprietary
[2] Boulter, B.T. Fox, H.W.,"Advanced Dynamic Simulation", ApICS Internal Systems Engineering Training Course.
[3] Hess, D.P., Soom, A. "Friction at a Lubricated Line Contact Operating at Oscillating Sliding Velocities" Journal of Tribology Transactions of the A.S.M.E. Vol 112, pp 147-152, 1992.
[4] Majd, V.J.. Simaan M. A., "A Continuous Friction Model For Servo Systems With Stiction", Proceedings of the 4th I.E.E.E. Conference on Control Applications, Albany NY. 1996.
[5] Zachary, J. R. (et. al.).,"The Development of Vehicular Powertrain System Modeling Methodologies: Philosophy and Implementation", Powertrain Control Research Laborotory, University of Wisconsin-Madison, 1998.
[6] Tuttle, Timothy. "Understanding and Modeling the Behavior of a Harmonic Drive Gear Transmission", Masters Thesis/Technical Report # 1365, MIT Artificial Intelligence Laboritory, 1996.
[7] Munns, Scott A., "Computer Simulation of Powertrain Components with Methodologies for Generalized System Modeling", M.S. Thesis, Department of Mechanical Engineering, University of Wisconsin-Madison, , 1996
|